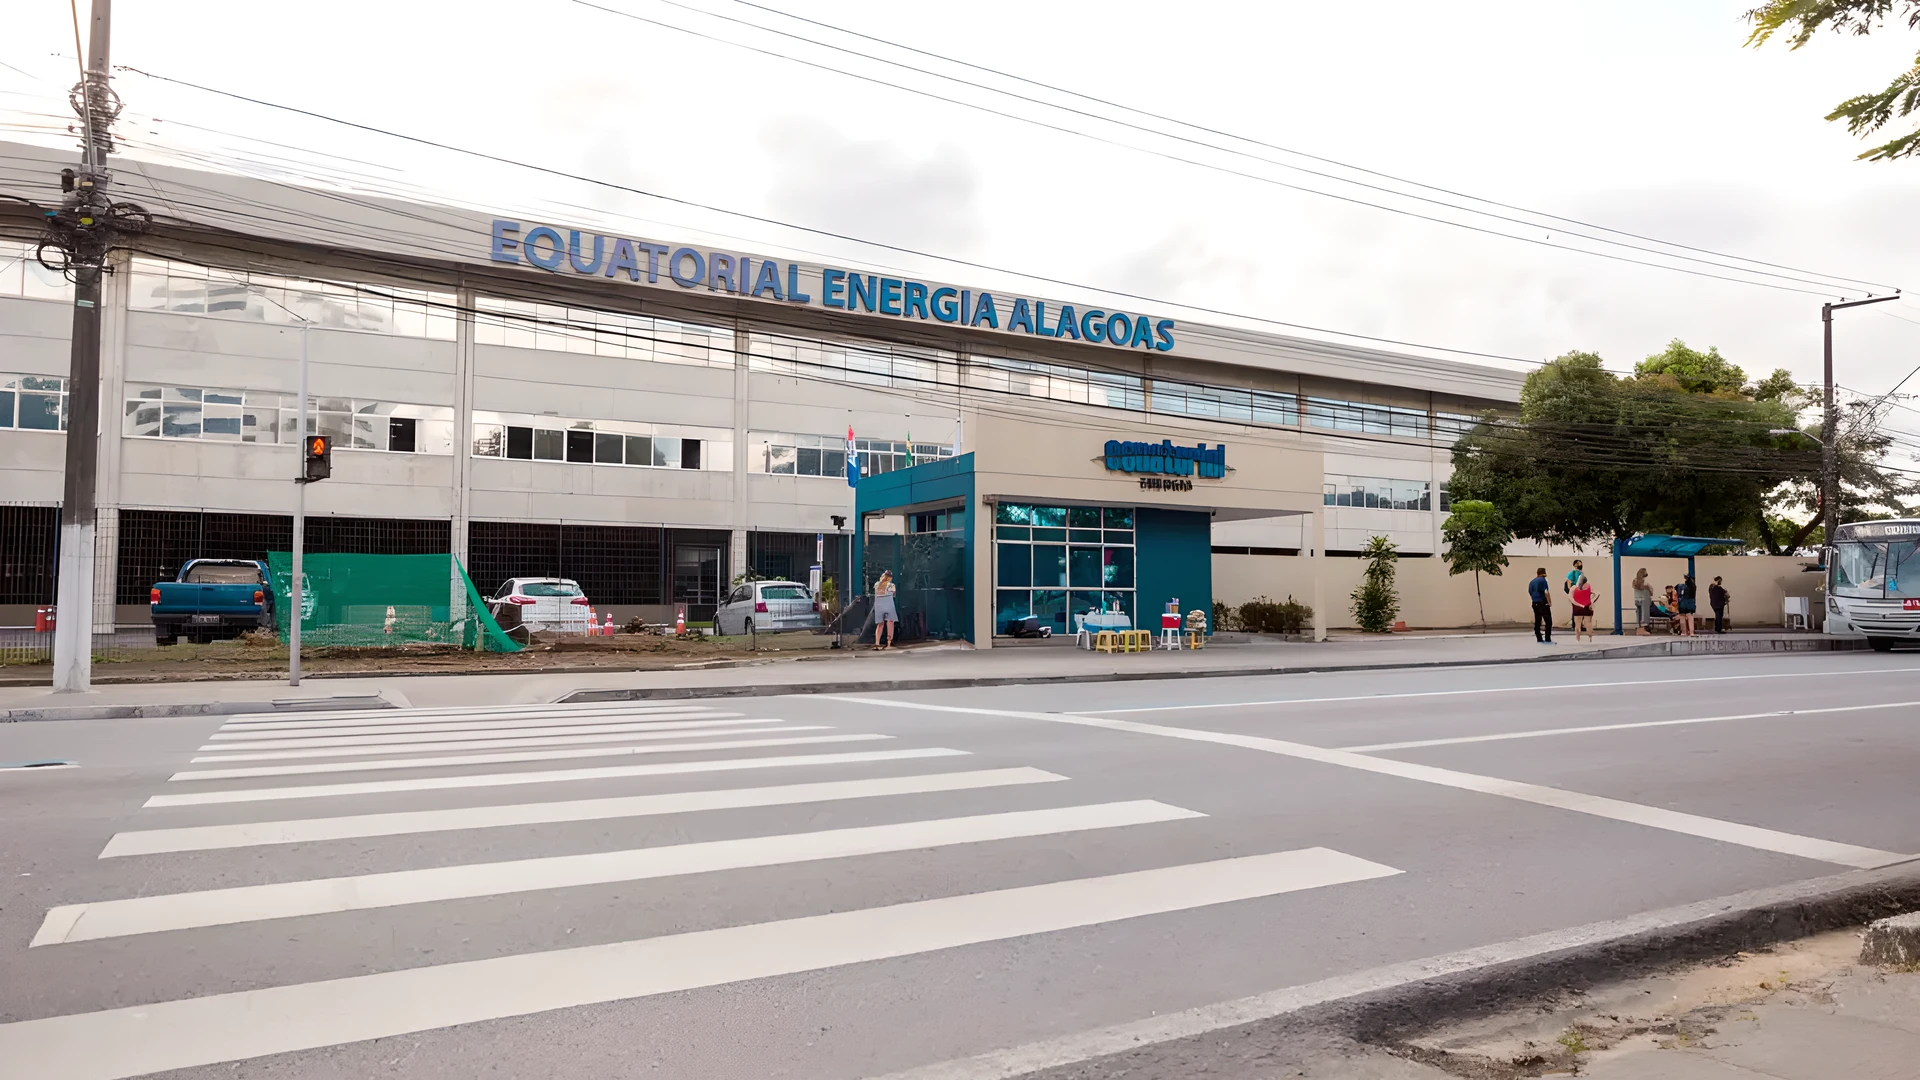
On Wednesday, July 29, 2026, Equatorial (EQTL3) released its preliminary and unaudited operating data for the second quarter of 2026. On a consolidated view of the distributors, gross injected energy increased 4.7% versus 2Q25, while the wire B market rose 4.2%. The company reported that a change in revenue recognition for free customers in Alagoas reduced the observed growth; excluding this effect, the consolidated wire B market would have posted a 5.0% increase.
Among the concessions, the wire B market saw positive highlights in Pará (+6.2%), Amapá (+6.1%), Goiás (+5.6%), Maranhão (+5.3%) and Rio Grande do Sul (+4.3%). In Alagoas, the change in revenue recognition timing for free customers, applied as of April 2026, began to recognize consumption in the month following measurement, which resulted in the deferral of roughly one month of revenue within the quarter; without this impact, the concession’s wire B market would have grown 3.0%. Energy injected by distributed micro and mini generation accounted for 10.3% of gross injected energy in Maranhão, 18.3% in Piauí, 13.5% in Alagoas, 17.1% in Goiás and 6.2% in Rio Grande do Sul.
Consolidated energy losses on a 12‑month basis stood at 17.9% in 2Q26, a decrease of 0.2 percentage point compared to 2Q25 and 0.1 percentage point versus 1Q26, remaining 1.0 percentage point below the regulatory level of 18.9%. The largest loss reductions versus 2Q25 occurred at CEA (‑1.8 p.p.), Equatorial Alagoas (‑0.8 p.p.), Equatorial Piauí (‑0.6 p.p.), Equatorial Maranhão (‑0.5 p.p.) and CEEE‑D (‑0.1 p.p.). The company reported that five distributors operate below the regulatory loss limit: Maranhão, Piauí, Alagoas, Goiás and Amapá.
In the renewable generation segment, Equatorial reported net generated energy of 1,014.2 GWh in 2Q26. Without the effects of constrained‑off (generation reduction due to power system constraints), generation would have totaled 1,243.7 GWh. According to the company, the result was influenced by a lower average wind speed, of 6.7 m/s versus 7.4 m/s in 2Q25, partially offset by higher average solar irradiance, of 305.7 W/m² compared to 289.1 W/m² in the same period of the previous year. Constrained‑off events reduced the portfolio’s generation potential by approximately 229 GWh, or 18.4%.
In sanitation, 2Q26 ended with around 93.4 thousand billed connections in the water distribution service, of which 18.9 thousand were also served with sewage collection and treatment. Compared to 2Q25, there was a 6.2% decline in the number of water connections, reflecting disconnection actions for delinquent customers, and a 6.0% reduction in billed water volume, to 5,200.8 thousand m³, influenced both by the smaller billed base and by the expansion of metering. Billed sewage volume, in turn, increased 11.8% to 1,139.6 thousand m³, with coverage ratios of 71.7% for water and 15.6% for sewage.