
What is gross margin?
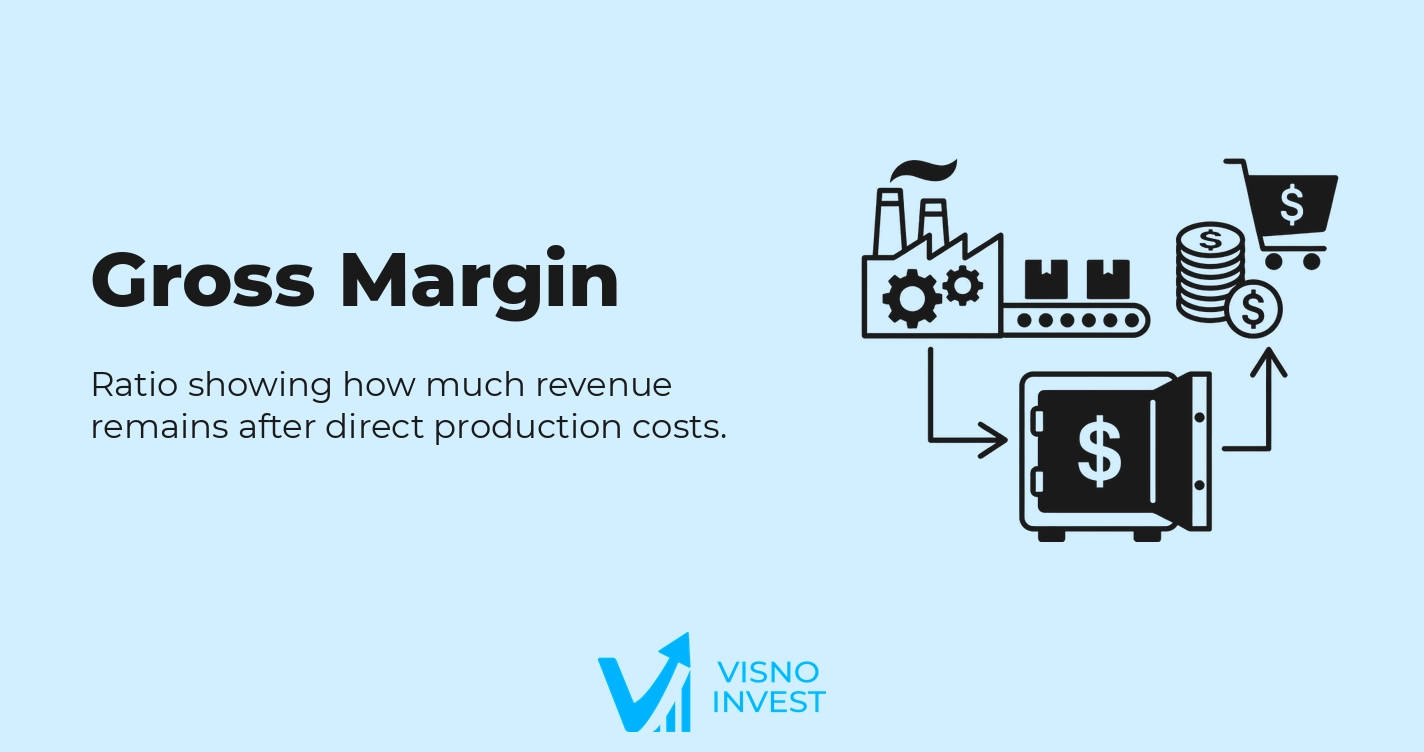
Gross margin is a profitability ratio that measures the share of net sales revenue that remains after deducting the cost of goods sold or of services provided. Expressed as a percentage, it shows how much of revenue is available to cover operating and financial expenses, taxes, and the generation of net income.
In accounting terms, gross margin relates gross profit to net revenue, reflecting the company's efficiency in pricing and in controlling the costs directly associated with production or service delivery. The higher the margin, the wider the gap between selling price and direct cost.
In fundamental analysis, gross margin is used to assess business quality, pricing power, cost structure, and the company's resilience to competitive pressure or input price shocks. It is one of the starting points for understanding the profitability structure down the income statement.
In addition, gross margin allows comparisons between companies in the same sector, analysis of historical trends, and evaluation of the impact of changes in product mix, productivity, and operating efficiency. Because it measures profit before operating expenses, it provides a relatively "pure" view of the profitability of the business's productive core.
How gross margin works and what its values indicate
The economic logic of gross margin lies in the difference between the selling price and the direct cost of producing or delivering the good or service. That difference, gross profit, represents the value the company creates in its core activity before administrative, selling, and financial expenses. By relating gross profit to revenue, gross margin normalizes this value, allowing comparison over time and across companies.
High gross margins tend to indicate businesses with a greater ability to pass on costs, lower sensitivity to changes in input prices, and, in many cases, greater product or service differentiation. Companies with strong brands, proprietary technology, or significant competitive barriers often show gross margins above the market average.
On the other hand, a low gross margin is usually associated with intensely competitive sectors, with undifferentiated products, high sensitivity to commodity prices, or limits on passing costs on to consumers. In these cases, small swings in cost can significantly compress gross profit, raising the risk to future profitability.
Reading gross margin must always take the sector context into account. Sectors such as food retail, distribution, and some industrial segments structurally operate with thin gross margins, compensating with high inventory turnover and scale. Software, specialized health care, or luxury goods sectors, by contrast, can operate with very high gross margins.
Gross margin also relates to long-term value creation. Businesses with structurally high and stable gross margins tend to be better able to absorb operating expenses, invest in growth, and still maintain attractive net income. By contrast, low-margin businesses depend more on extreme operating efficiency and scale to sustain adequate returns on capital.
How to calculate gross margin
Calculating gross margin is straightforward, using the first lines of the income statement. You start from net sales revenue and subtract the cost of goods sold (COGS) or the cost of services provided, arriving at gross profit. You then relate that gross profit to net revenue.
Gross margin formula:
Gross Margin (%) = (Gross Profit / Net Revenue) × 100
Gross Profit: the difference between net revenue and the cost of goods sold or services provided. It is presented explicitly in the income statement. In accounting terms:
Gross Profit = Net Revenue – Cost of Goods Sold (COGS)
Net Revenue: gross sales revenue minus deductions such as returns, rebates, unconditional discounts, and taxes levied on sales. It is also detailed in the income statement.
COGS or cost of services: the costs directly associated with producing the goods or delivering the services, such as raw materials, direct labor, manufacturing depreciation, and other directly attributable manufacturing or delivery costs.
The accounting data used in the calculation come entirely from the income statement, on both a quarterly and an annual basis. For more detailed analyses, analysts often use rolling 12-month periods (LTM/TTM), adding up the income statements for the last four quarters to smooth out seasonality and one-off events.
Additional adjustments may include excluding nonrecurring items embedded in COGS (such as extraordinary provisions, significant inventory adjustments, or one-time restructuring impacts) to arrive at an adjusted gross margin. For companies diversified across business lines, it is also common to analyze segment gross margins when the company discloses profitability by business unit or product.
Practical calculation example
Consider a fictional consumer goods company that, in a given year, reported the following income statement data (amounts in millions of reais): gross revenue of R$1,300, deductions of R$100, and cost of goods sold of R$700.
The first step is to determine net revenue:
Net Revenue = Gross Revenue – Deductions
Net Revenue = R$1,300 – R$100 = R$1,200
Next, calculate gross profit:
Gross Profit = Net Revenue – COGS
Gross Profit = R$1,200 – R$700 = R$500
Applying the gross margin formula:
Gross Margin (%) = (Gross Profit / Net Revenue) × 100
Gross Margin (%) = (R$500 / R$1,200) × 100 ≈ 41.7%
The result indicates that approximately 41.7% of this company's net revenue remains after deducting direct production costs. That percentage represents the cushion available to cover selling, general, and administrative expenses, financial expenses, taxes, and still generate net income for shareholders.
In a sector context, if comparable consumer goods companies operate with an average gross margin of around 35%, this hypothetical company would have an above-average margin, suggesting greater cost efficiency, brand strength, price positioning, or a combination of these factors. That difference could matter in the analysis of competitiveness and in valuation, provided it is consistent over time.
Using gross margin in company analysis
In practice, gross margin is used as a core indicator of primary operating profitability, serving as the basis for several analyses in company valuation. Together with EBITDA margin, operating margin, and net margin, it makes up the cascading margin analysis down the income statement, helping you understand at which stages of the earnings structure the company creates or consumes value.
In sector analyses, gross margin helps identify companies that are more cost-efficient or have greater pricing power. In sectors with structurally low margins, small gains in gross margin can be decisive for competitiveness. In high-margin sectors, stability or expansion of gross margin can signal a strengthening of competitive advantages.
In valuation, gross margin is an important parameter for projecting future results in discounted cash flow (DCF) models, because it is tied to the ability to generate operating cash. Projections of gross margin expansion or compression directly affect expectations for gross profit, operating income, and, consequently, the estimated fair value of the company.
The metric is also relevant in the analysis of economic cycles. During periods of cost pressure (for example, rising commodity prices or exchange rates), companies with a track record of more robust gross margins tend to be more resilient, whether through the ability to pass on costs or through more efficient production structures. Declines or recoveries in gross margin over the cycle can signal changes in competitiveness.
In specific scenarios, such as changes in product mix, the launch of premium lines, or gains in scale, gross margin is often monitored to assess whether the commercial strategy is resulting in greater value capture. Combining gross margin with metrics such as inventory turnover, average ticket, revenue growth, and Return on Equity (ROE) provides a more complete view of how effective the business strategy is.
Gross margin vs. related metrics
Although fundamental, gross margin does not exhaust profitability analysis. Other margin and return metrics complement how it is read, each capturing different dimensions of the earnings structure and of value creation. The comparisons below highlight conceptual and practical differences between gross margin and other widely used metrics.
Gross margin vs. EBITDA margin
Gross margin considers only the relationship between gross profit and net revenue; that is, it captures profitability after direct production costs but before operating expenses. EBITDA margin, in contrast, relates earnings before interest, taxes, depreciation, and amortization (EBITDA) to net revenue, incorporating the effect of selling, general, and administrative expenses but excluding noncash accounting items.
Methodologically, gross margin uses gross profit, while EBITDA margin uses the result after deducting recurring operating expenses but before depreciation, amortization, and financial results. EBITDA margin is therefore closer to recurring operating cash generation, while gross margin focuses on the profitability of the productive core.
In practice, gross margin is better suited to assessing production cost efficiency, pricing structure, and brand strength. EBITDA margin is preferred for analyzing operating cash-generating capacity and for comparing companies with different levels of capital intensity, since it partly neutralizes the effect of depreciation and amortization.
Gross margin vs. operating margin
Operating margin relates operating income (earnings before financial results and income taxes) to net revenue. It therefore includes the full impact of operating expenses, such as selling, administrative, general, and research and development expenses, and other recurring operating expenses and income.
While gross margin evaluates only the gap between revenue and direct costs, operating margin incorporates the efficiency of overhead management, selling and administrative spending, and the policy on recurring expenses. Conceptually, it is a broader metric, since it brings profitability closer to the operation as a whole, already net of the structure that supports the business.
In terms of use, gross margin is helpful for isolating issues related to pricing and direct cost, while operating margin is used to assess the business model in its complete structure, including support efficiency, logistics, marketing, and administration. Significant differences between gross margin and operating margin can indicate more or less efficient operating expense structures.
Gross margin vs. net margin
Net margin relates net income to sales, integrating all the effects of operating expenses, financial expenses and income, income taxes, and any nonoperating results. It is the most comprehensive margin metric, reflecting the final result available to shareholders.
While gross margin focuses exclusively on the initial stage of earnings formation, net margin incorporates the entire capital structure (debt, cost of debt), the tax regime, and other items below the operating line. As a result, net margin can be affected by factors not directly related to the core business, such as a leveraged capital structure or tax credits.
In practice, gross margin is more stable and more directly tied to the economic characteristics of the business. Net margin, in turn, shows how much of revenue actually converts into final profit, which is useful for assessing overall return but requires breaking it down to identify whether changes stem from operating, financial, or tax factors.
Advantages and limitations of gross margin
Advantages
A first advantage of gross margin is the simplicity of calculating and interpreting it. All the necessary components are clearly identified in the income statement, and the relationship between gross profit and net revenue is easy to understand, allowing a quick assessment of the basic profitability of the company's core operation.
Another relevant advantage is its usefulness in comparing companies in the same sector. Because it concentrates on revenue and direct costs, gross margin is less influenced by decisions on capital structure, the tax regime, or accounting depreciation policies, which makes sector comparisons more objective when it comes to production efficiency and pricing power.
Gross margin is also sensitive to changes in product mix, price repositioning, and productivity improvements. This makes the metric particularly useful for monitoring the effectiveness of commercial and operating strategies over time, identifying whether management initiatives are in fact raising value capture per unit of revenue.
Finally, gross margin is often used as a basis for projections in valuation models and scenario analysis. Small variations assumed in gross margin over long horizons can result in significant differences in projected cash flows, which gives the metric a central role in financial modeling.
Limitations
An important limitation of gross margin is its dependence on the correct accounting classification between costs and expenses. Differences in criteria across companies, or internal changes in accounting policy, can shift items between COGS and operating expenses, changing gross margin without necessarily reflecting a real economic change in the business's profitability.
Nonrecurring events classified in COGS, such as extraordinary inventory write-offs, provision adjustments, or one-time impacts from production restructurings, can distort gross margin in certain periods. Without analytical adjustments, a point-in-time reading can lead to incorrect conclusions about the company's structural profitability.
Changes in accounting standards (such as the adoption of new pronouncements that affect revenue recognition or cost allocation) can alter the historical series of gross margin or make it less comparable across periods. Analysts need to assess the methodological consistency of the financial statements, especially during major regulatory transitions.
Another limitation is that gross margin does not capture efficiency in managing operating expenses, administrative structure, and selling expenses. Companies may show a high gross margin but consume that benefit in operating cost structures or high financial expenses, resulting in modest net margins. The metric should therefore not be analyzed in isolation.
FAQ
What does a high gross margin mean?
A high gross margin indicates that the company retains a significant share of net revenue after covering the direct costs of production or service delivery. In general, it suggests greater pricing power, production efficiency, product differentiation, or a combination of these factors. It should be compared with peers in the same sector and analyzed together with other margin metrics.
What does a low gross margin mean?
A low gross margin means that the gap between selling price and direct cost is small, leaving less cushion for operating and financial expenses and taxes. This is common in highly competitive sectors with low pricing power. On its own, it does not imply the business is unviable, but it demands greater operating efficiency and high sales volume to sustain adequate profitability.
What is the ideal gross margin?
There is no universal ideal gross margin, because the level considered healthy varies widely across sectors. The right benchmark is comparison with comparable companies and with the company's own historical series. In general, stable or rising margins, in line with or above the sector average, are signs of competitiveness and operating consistency.
Is gross margin enough to evaluate a company's profitability?
Gross margin is not enough on its own to evaluate overall profitability. It focuses on the relationship between revenue and direct costs, but does not incorporate operating expenses, financial results, and taxes. For a complete picture, it should be analyzed together with EBITDA margin, operating margin, net margin, and return metrics such as ROE and Return on Assets (ROA).
Why can gross margin vary over time?
Gross margin can vary for several reasons: changes in input prices, the ability to pass on costs, shifts in product mix, productivity gains or losses, exchange rate swings that affect the cost of imported raw materials, and strategic decisions to reposition prices. One-off accounting events in COGS can also affect the metric in certain periods.