
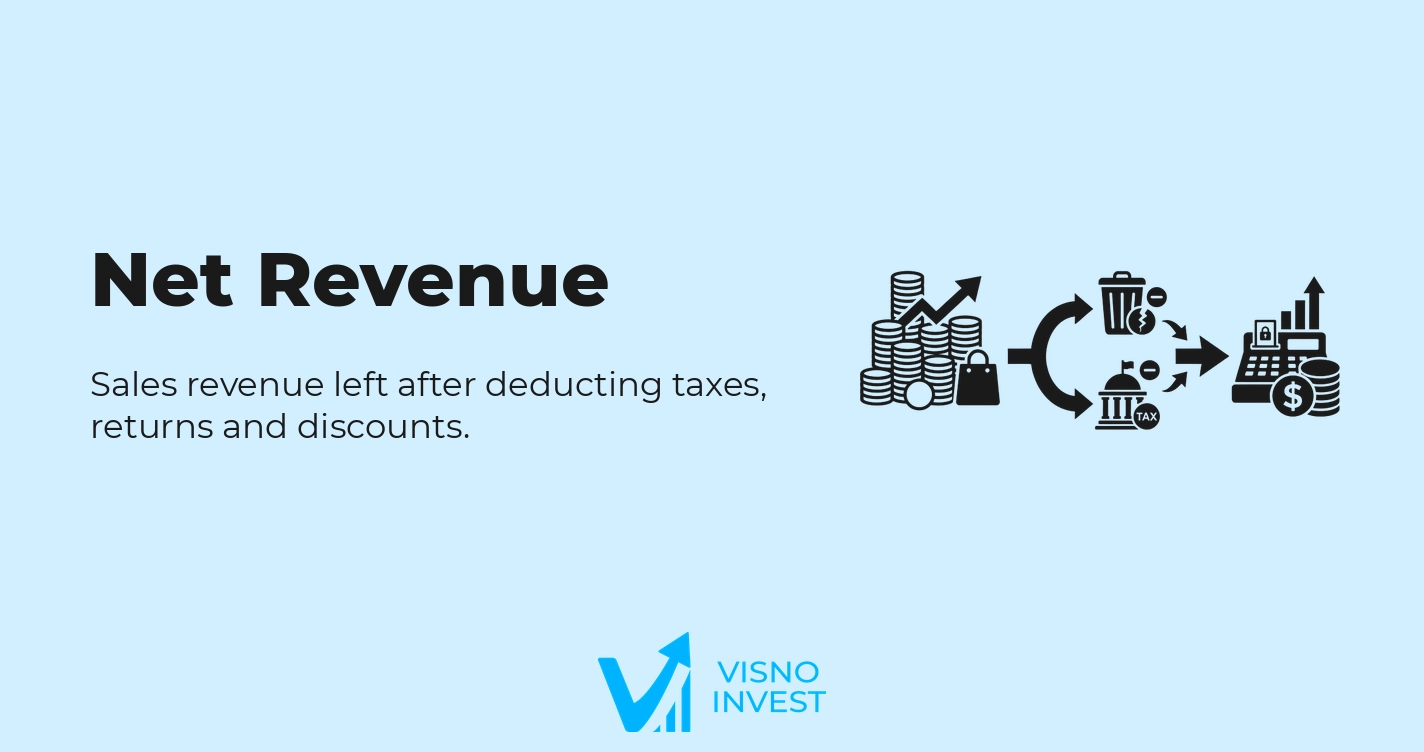
What is net revenue?
Net revenue is the value of a company's sales of goods or services after deducting returns, allowances, discounts granted, and taxes levied on billings. It represents the amount actually recognized as operating revenue, serving as the basis for analyzing growth, profitability, and economic performance over time.
In accounting terms, net revenue is gross sales revenue adjusted for sales taxes (such as ICMS, PIS, Cofins, and ISS), merchandise returns, bonuses, and unconditional trade discounts. It is the first line of the income statement after the regulatory and commercial adjustments to gross billings.
In fundamental analysis, net revenue is the main indicator of operating revenue generation, and it is the starting point for calculating margins (gross margin, EBITDA margin, net margin), productivity, and market share. It is also used as a basis in valuation models, cash flow projections, and long-term growth analyses.
From the investor's point of view, the evolution of net revenue makes it possible to assess the capacity of the core business to expand, the resilience of the business model across economic cycles, and the consistency between sales growth, profitability, and capital structure.
How net revenue works and what its values indicate
The economic logic of net revenue is tied to the sales value actually recognized by the company, after deducting all the elements that do not represent the company's own revenue but rather pass-throughs or mandatory adjustments. This includes indirect taxes on billings and discounts granted to customers for commercial or operational reasons.
High net revenue values, in absolute terms, indicate scale of operations and the ability to generate sales in the core business. In relative terms, growth in net revenue over time signals volume expansion, price increases, market share gains, or a combination of these factors, depending on the characteristics of the sector and the commercial policy.
On the other hand, low growth or a decline in net revenue may indicate a loss of competitiveness, weakening demand, an adverse change in product mix, price pressure, or the discontinuation of business lines. In some cases, it may reflect strategic decisions, such as a focus on higher-margin segments, even at the cost of lower sales volume.
Net revenue is also tied to value creation through its interaction with costs, expenses, and capital structure. Revenue growth without cost control can lead to compressed margins, while growth combined with operating efficiency gains tends to improve results and return capital to shareholders through earnings, dividends, or reinvestment in projects with an adequate return.
Sector context is decisive in interpreting the level and trajectory of net revenue. Capital-intensive sectors with long-term contracts tend to show more stable growth, while cyclical sectors or those dependent on discretionary consumption can show greater volatility. A proper reading requires comparison with peers, the economic cycle, and the specific characteristics of the business model.
How to calculate net revenue
The calculation of net revenue starts from Gross Sales or Services Revenue, as recorded in the income statement, and subtracts adjustments related to taxes and commercial deductions. The basic accounting formula can be represented as follows:
Net Revenue = Gross Sales Revenue − Sales Deductions − Sales Taxes
Sales deductions include returns, allowances, bonuses, and unconditional trade discounts granted at the time of sale. Sales taxes, in turn, comprise taxes such as ICMS, PIS, Cofins, ISS, and other indirect taxes that apply directly to billings and are not part of the company's own revenue.
In practice, the information needed to determine net revenue is found in the income statement, generally presented on specific lines for gross revenue, deductions, and taxes. At some companies, especially regulated ones or those in specific sectors, the details may appear in the notes to the financial statements, but the final net revenue figure is always shown in the income statement.
Fundamental analysts frequently use net revenue on annual and quarterly bases, as well as on rolling 12-month windows (LTM/TTM – last twelve months). Using LTM net revenue smooths out seasonal effects and allows a more consistent analysis of growth and profitability trends.
Additional adjustments to net revenue are common when there are nonrecurring items or relevant reclassifications, such as recognition of extraordinary revenue, effects of mergers and acquisitions, or changes in accounting standards. In valuation models, the historical series can be adjusted to make periods comparable when they were affected by regulatory or tax changes that altered how revenue is recognized without reflecting a structural change in demand.
Practical example of calculating net revenue
Consider a company that, in a given fiscal year, reported the following figures in its income statement:
- Gross Sales Revenue: R$1,000,000,000
- Returns and allowances: R$20,000,000
- Unconditional trade discounts: R$10,000,000
- Sales taxes (ICMS, PIS, Cofins, ISS, etc.): R$180,000,000
First, the sales deductions are added up:
Sales Deductions = Returns + Trade Discounts
Sales Deductions = R$20,000,000 + R$10,000,000 = R$30,000,000
Next, the net revenue formula is applied:
Net Revenue = Gross Sales Revenue − Sales Deductions − Sales Taxes
Net Revenue = R$1,000,000,000 − R$30,000,000 − R$180,000,000
Net Revenue = R$790,000,000
The result of R$790 million is the net revenue, that is, the actual sales value recognized by the company as operating revenue after all mandatory and commercial adjustments. From this amount, cost of goods sold, operating expenses, and other items will be deducted to arrive at profit.
If comparable companies in the same sector report annual net revenue of R$800 to R$900 million, this level of sales would indicate a similar size. However, analyzing this figure in isolation is not enough. You need to look at net revenue's growth history, the evolution of margins (gross margin, operating margin, net margin), and the relationship with profitability ratios such as Return on Equity (ROE) and Return on Invested Capital (ROIC).
Using net revenue in company analysis
In practice, net revenue is used as a central indicator in analyzing a company's growth, scale, and market relevance. The evolution of net revenue over the years makes it possible to identify structural trends of expansion or contraction, as well as the effects of economic cycles, competitive dynamics, and strategic decisions on the product portfolio.
In margin analysis, net revenue is the standard denominator for ratios such as gross margin, EBITDA margin, EBIT margin, and net margin. Net revenue growth combined with stable or expanding margins is a sign of operational strengthening, while growth accompanied by margin compression may indicate rising costs, competitive pressure, or reduced pricing power.
In valuation, net revenue is the basis for revenue projections in discounted cash flow (DCF) models, helping to estimate long-term growth, volume and price drivers, and the maturity of the business life cycle. In relative models, metrics such as Price-to-Sales (P/S) use net revenue as the denominator to compare companies at different stages of profitability but with a similar sales profile.
Net revenue is also relevant in business segment analysis, when companies report revenue by product line, geography, or business unit. This breakdown makes it possible to assess which segments are growth drivers, which are slowing, and how that affects the risk and return profile of the company as a whole.
A typical application involves analyzing an expanding company that grows net revenue by opening new stores or production units. The analyst will look not only at the percentage growth in net revenue, but also at indicators such as sales per unit, average ticket, revenue per square meter or per customer, comparing incremental productivity with the investment required and with the expected return on capital.
Net revenue vs. related metrics
Net revenue vs. gross revenue
Gross revenue is the total value of sales before any deduction for taxes, returns, or trade discounts. Net revenue is gross revenue adjusted for these items, reflecting the revenue actually recognized by the company as a result of its operations.
Conceptually, the main difference lies in the nature of the amounts deducted. Part of gross revenue is, in practice, a pass-through of taxes to the government or a commercial adjustment that does not translate into the company's own revenue. That is why net revenue is the standardized measure of sales in the income statement and in fundamental analysis.
Analytically, gross revenue can be useful for assessing commercial and tax policies, such as the level of discounts or the impact of tax regimes. However, for comparability between companies and for calculating margins and valuation multiples, net revenue is the main reference, since it neutralizes effects that do not represent value retained by the company.
Net revenue vs. billings
In everyday usage, the term billings (faturamento in Portuguese) can be used generically to refer to both gross revenue and net revenue, which can create ambiguity. In technical accounting language, the concept of net revenue is more precise, since it follows criteria defined by accounting standards and the income statement.
When a company refers to billings without specifying whether they are gross or net, comparison with other companies can suffer. In standardized reports, net revenue is preferable as a basis for analysis, because it eliminates deductions and the taxes levied and allows greater uniformity across sectors and different tax regimes.
Analytically, using net revenue instead of a generic notion of billings reduces the risk of overestimating the real scale of the business, especially in sectors with a high tax burden on sales or with a high volume of returns and trade discounts.
Net revenue vs. net income
Net revenue and net income are distinct lines in the income statement. Net revenue represents adjusted sales, while net income is the final result after deducting costs, operating expenses, financial expenses, income taxes, and other nonoperating items.
Conceptually, net revenue measures only the top of revenue generation, without considering efficiency in managing costs and expenses. Net income, in turn, incorporates all the effects of the cost structure, financial leverage, taxation on profit, and nonrecurring events.
In fundamental analysis, net revenue is used to assess growth and scale, while net income is used to measure final profitability, the basis for ratios such as Earnings per Share (EPS), Price-to-Earnings (P/E), and payout. Growth in net revenue combined with a healthy evolution of net income is a sign of a robust business model.
Advantages and limitations of net revenue
Advantages of net revenue
The main advantage of net revenue is accounting standardization. Because it is defined by the rules for preparing the income statement, it allows consistent comparison between companies and periods, even in sectors with different tax structures and trade discounts. This makes it a basic reference in fundamental analysis.
Net revenue is relatively simple to calculate, based on information directly available in the income statement. This simplicity makes it easier to use in historical series, growth projections, and valuation models, reducing the risk of calculation and interpretation errors by analysts and investors.
Net revenue offers a clear view of the business's operating scale, since it reflects the volume of revenue actually recognized, not just gross amounts subject to tax pass-throughs. That is why it is the natural basis for calculating operating margins and comparing productivity between companies in the same sector.
In segment analyses, net revenue by business unit, region, or product line makes it possible to identify growth drivers, dependence on certain markets, and revenue concentration. This visibility helps in assessing risk, diversification, and the resilience of the business model.
Limitations of net revenue
A relevant limitation of net revenue is that, on its own, it carries no information about costs, expenses, and capital structure. A company can post strong net revenue growth and still destroy value if that growth comes with excessive costs, compressed margins, or high financial leverage.
Changes in accounting standards, especially under IFRS, can alter how revenue is recognized in certain sectors, affecting the historical net revenue series. Examples include long-term contracts, leases, and loyalty programs. Without proper adjustments, comparisons over time can become less accurate.
Nonrecurring events can affect net revenue on a one-off basis, such as recognition of specific revenue, accounting reclassifications, or changes in the tax regime. Although less frequent than on other earnings lines, these effects can create artificial spikes or drops in growth, requiring complementary qualitative analysis.
Another point is that net revenue does not directly reflect the quality of revenue, that is, its predictability, recurrence, or concentration in a few customers or contracts. Two companies with the same net revenue can have very different risk profiles if one depends on a few large contracts and the other has a diversified, recurring base.
FAQ
What does high net revenue mean?
High net revenue indicates that the company has a large scale of operations and the ability to generate sales after deductions for taxes and trade discounts. However, this level should be analyzed together with profit margins, cost structure, debt, and return on capital, as well as comparisons with competitors in the same sector.
What does low net revenue mean?
Low net revenue may indicate small size, limited market presence, an early stage of development, or a loss of competitiveness. On its own, it does not imply weakness, since niche companies can operate with lower sales and high profitability. A proper interpretation depends on the sector, strategy, and comparison with peers.
What is the ideal net revenue growth rate?
There is no ideal net revenue growth rate that applies to all companies. Desirable growth depends on the sector, stage of maturity, economic cycle, and return on invested capital. In general, analysts look for sustainable net revenue growth that is compatible with operating capacity and accompanied by healthy margins.
What is the difference between net revenue and operating revenue?
Net revenue corresponds to sales net of taxes and deductions directly associated with the core business. Operating revenue, in some income statement formats, may include other business-related revenue, such as complementary services. In practice, many companies use the terms similarly, which calls for attention to the specific structure of the income statement.
Can net revenue grow while profit falls?
Yes. Net revenue can grow while profit falls if there is a proportionally larger increase in costs, operating expenses, financial expenses, or the tax burden on profit. This scenario indicates that sales growth is not translating into additional value creation for shareholders.