
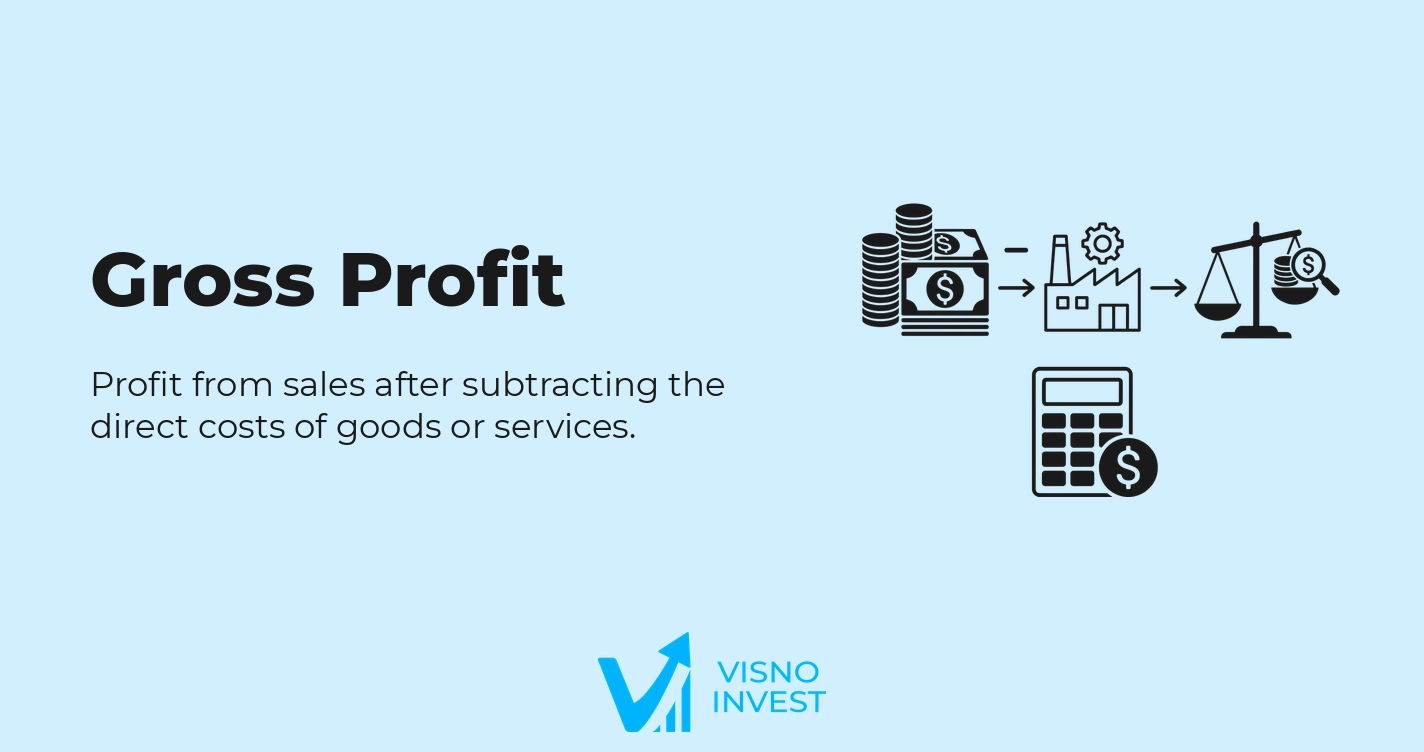
What is gross profit?
Gross profit is the result a company earns after subtracting the cost of goods sold or the cost of services rendered from net sales revenue in a given period. This metric measures the direct profitability of commercial operations, before operating and financial expenses, taxes, and nonrecurring items, and it is the basis for assessing production efficiency and pricing.
From an accounting standpoint, gross profit is an intermediate line of the income statement, positioned between net revenue and operating income. It shows the gain earned exclusively from the core business, reflecting the balance among selling price, volume, product mix, and direct cost structure.
In fundamental analysis, gross profit is used to assess the quality of the business model, pricing power, competitiveness, and the company's ability to absorb administrative, selling, and financial expenses. It is also the basis for calculating gross margin, one of the main operating profitability ratios.
In addition, gross profit is a relevant input in valuation analyses, especially in inventory-intensive or production-intensive sectors. Structural changes in this metric over time can signal shifts in the cycle, cost pressure, strategic repositioning, and gains or losses in operating efficiency.
How gross profit works and what its values indicate
The economics of gross profit come down to the difference between the selling price and the cost of the goods or services directly tied to generating the revenue. In microeconomic terms, it represents the company's primary operating surplus, before fixed administrative costs and the expenses that support operations.
A high gross profit, in absolute terms, indicates a greater ability to generate gross operating earnings from sales. When analyzed together with gross margin, it signals whether the company is able to pass cost increases through to customers, keep prices at favorable levels, and exploit economies of scale in the production process or supply chain.
Relatively high gross profit, compared with net revenue and with the company's own history, can indicate a competitive advantage, brand power, logistics efficiency, favorable supply contracts, or an optimized production process. In scalable business models, gross profit usually grows faster than fixed costs, increasing operating leverage.
On the other hand, low, flat, or falling gross profit, even when revenue is rising, can signal competitive pressure on prices, higher input costs, a deteriorating sales mix (more weight on lower-margin products), or lost efficiency in production and distribution. This dynamic reduces the company's ability to absorb operating expenses and tends to put pressure on net income.
Sector context is decisive in interpreting gross profit. Grocery retail, for example, typically operates with a low gross margin but high inventory turnover and scale. Software, specialized services, or premium brands tend to show proportionally higher gross profit, reflecting lower direct variable costs. A proper analysis requires comparison with peers in the same segment and business model.
How to calculate gross profit
Calculating gross profit is straightforward, because it comes from the standard structure of the income statement. The formula relates net sales revenue to the cost directly associated with producing or acquiring the goods and services sold in the period.
Gross profit formula:
Gross Profit = Net Sales Revenue − Cost of Goods Sold (COGS) or Cost of Services Rendered (COSR)
Net Sales Revenue is gross sales revenue less returns, discounts, allowances granted, and taxes levied on sales. This figure appears at the top of the income statement. It refers to the revenue actually recognized under current accounting standards (IFRS).
Cost of Goods Sold (COGS) or Cost of Services Rendered (COSR) represents the expenses directly attributable to producing or acquiring goods or providing services. It includes, for example, raw materials, direct labor, production costs, factory depreciation, and the cost of merchandise resold. The COGS/COSR line is also found in the income statement, just below net revenue.
In retail companies, COGS mainly reflects the acquisition cost of the merchandise sold, adjusted for inventory movements. In industrial companies, COGS involves manufacturing costs, absorbing the fixed and variable expenses of the production plant. In services, COSR covers technical labor, commissions, or other costs directly related to delivering the service.
Analysts often make adjustments to gross profit for purposes of fundamental analysis and valuation. Common ones include: using data for the last twelve months (LTM/TTM) to smooth out seasonal effects; reclassifying atypical items between COGS and operating expenses when they distort comparability; and breaking results out by business segment, when the company discloses information by operating unit or product line.
Worked example
Consider a retail company that reports annual gross revenue of R$1,200 million in its income statement. After returns, discounts, and sales taxes, net sales revenue totals R$1,000 million. The cost of goods sold, as shown in the income statement, is R$700 million.
Using the formula, gross profit is calculated as follows:
Net Sales Revenue = R$1,000 million
COGS = R$700 million
Gross Profit = R$1,000 million − R$700 million = R$300 million
In this scenario, gross profit of R$300 million represents the result generated by the basic commercial activity alone, before administrative, selling, general, and financial expenses and before taxes on profit. The corresponding gross margin would be 30% (R$300 million / R$1,000 million), a ratio often used together with absolute gross profit.
Suppose comparable companies in the same segment operate with an average gross margin of 25%. The company in the example, with a 30% margin and gross profit of R$300 million, shows better efficiency in managing prices and direct costs. However, a complete analysis requires checking operating expenses, capital structure, cash generation capacity, and the level of competitiveness.
In a fundamental analysis process, the analyst can project the growth of net revenue and gross profit over time, assessing the stability or expansion trend of the gross margin. This dynamic is crucial for discounted cash flow models, because it influences the future ability to absorb expenses and generate operating profit and free cash flow.
Using gross profit in company analysis
In practice, gross profit is one of the first items examined when analyzing companies, especially in businesses that are inventory-intensive or heavy in variable costs. It lets you quickly assess the economic appeal of the core business, before the influence of the administrative structure, financial leverage, and tax effects.
In sectors where price is a central competitive factor, such as retail, agribusiness, and some consumer goods industries, regularly tracking gross profit and gross margin is essential to spot lost competitiveness, changes in product mix, inflationary pressure on inputs, or shifts in commercial policy.
Gross profit is also used alongside metrics such as operating margin, EBITDA margin, net margin, return on equity (ROE), and return on invested capital (ROIC). Combining these metrics helps identify at which level of the income statement any profitability losses occur: in the formation of gross profit, in operating expenses, in the capital structure, or in the tax burden.
In relative valuation, analysts can compare gross margin among companies in the same sector to identify business models with greater pricing power or cost efficiency. In absolute valuation, gross profit projections are a relevant input for estimating future margins, operating cash generation capacity, and, as a result, the intrinsic value of the business.
A typical application scenario arises when a company announces a significant increase in revenue, but gross profit is flat or lower. This behavior can indicate growth driven by discounts, aggressive promotions, or lower-margin products. A detailed analysis of gross profit, together with segment data, shows whether the growth is sustainable or compromises the structural profitability of the operation.
Gross profit vs. related metrics
Gross profit vs. gross margin
Gross profit is an absolute value, while gross margin is a relative ratio obtained by dividing gross profit by net sales revenue. The former expresses the amount of profit generated by operations; the latter measures the percentage profitability of sales, allowing direct comparison between companies of different sizes.
In companies with strong revenue growth, gross profit can rise in absolute terms even as gross margin is squeezed. In that case, looking at gross profit alone could suggest an improvement, while gross margin would reveal a loss of per-unit profitability. For this reason, the two metrics are considered complementary in fundamental analysis.
Gross profit is better suited to assessing the absolute capacity to generate earnings, which matters in cash flow valuation models, especially in scenarios where fixed expenses can be diluted as scale increases. Gross margin, in turn, is more useful for comparing companies and for assessing changes in cost and price structure over time.
Gross profit vs. operating income (EBIT)
Gross profit considers only net revenue minus the cost of goods sold or services rendered. Operating income (often approximated by EBIT) also incorporates selling, general, and administrative expenses, as well as other operating income and expenses. It is a lower level of the income statement, reflecting full operating performance.
While gross profit measures the efficiency of the business's production or commercial core, operating income captures the efficiency of the administrative, commercial, and support structure. A company can show robust gross profit but low or negative operating income if operating expenses are high or inefficient.
In fundamental analysis, gross profit is used to identify the economic strength of the core business, whereas operating income is used to assess the overall efficiency of management and the fixed cost structure. In operational restructuring assessments, it is common to analyze the relationship between gross profit and operating income to understand how far fixed expenses compromise the operation's potential.
Gross profit vs. net income
Net income is the bottom line of the income statement, after deducting operating and financial expenses, taxes, and other nonoperating items. Unlike gross profit, which focuses on the core business, net income incorporates the effects of capital structure, financing policy, foreign exchange variations, nonrecurring results, and the tax burden.
A company can post solid gross profit and still report low or negative net income because of heavy financial expenses, a high effective tax rate, or extraordinary accounting effects. In that context, gross profit shows the business's capacity to generate earnings, while net income shows the result actually attributable to shareholders.
Gross profit is preferred for operating comparisons between companies with different capital structures, because its calculation is not affected by financial leverage or debt policies. Net income, in turn, is essential for return metrics such as earnings per share (EPS) and return on equity (ROE).
Advantages and limitations of gross profit
Advantages
One of the main advantages of gross profit is how simple it is to calculate and understand. The figure is available directly in the income statement, requires no complex estimates, and is easily reconciled with other levels of earnings. This makes it handy for quick analyses, company screening, and recurring monitoring of basic operating performance.
Another advantage is its ability to isolate the effect of the main operating core, without interference from capital structure, the financial result, or the tax burden. This makes gross profit particularly useful for comparing companies with different debt levels, tax regimes, or financing structures, focusing only on direct competitiveness and operating efficiency.
Gross profit also allows detailed analysis by business segment, when the company discloses segment information. In those cases, you can identify which product lines, sales channels, or geographies contribute most to gross profitability, guiding strategic decisions and assessments of the business model's sustainability.
Finally, gross profit tends to be less sensitive to certain nonrecurring items that affect net income, such as one-off tax effects or financial revaluations. Although it can be affected by accounting adjustments to inventories or costs, it tends to offer a steadier view of basic operating performance, especially in historical series analysis.
Limitations
Despite its relevance, gross profit has important limitations. One is its dependence on accounting classification practices between cost and operating expense. Internal changes in criteria or differences between companies can make direct comparisons difficult, especially in sectors where the allocation of costs between COGS and selling expenses is not standardized.
Another limitation comes from the impact of nonrecurring events related to inventory and costs, such as provisions for losses, adjustments to net realizable value, or reclassifications of cost items. These effects can inflate or reduce gross profit in a given period without reflecting the operation's structural profitability, calling for a qualitative review of the explanatory notes and management announcements.
Changes in accounting standards, such as the adoption of new IFRS pronouncements, can alter the treatment of certain costs and revenues, affecting historical gross profit. Adjustments to long-term contracts, leases, or revenue recognition can change the makeup of the income statement, so be cautious when comparing series before and after regulatory changes.
In addition, gross profit does not take into account operating expenses that matter for the sustainability of the business, such as spending on marketing, technology, distribution logistics outside the factory, and the administrative structure. A company can show high gross profit and still fail to generate consistent cash or net income if its expense structure is excessively heavy, which calls for an integrated analysis with other levels of earnings.
FAQ
What does a high gross profit mean?
A high gross profit indicates that the company generates a significant amount of earnings from its net revenue, before operating and financial expenses. In general, it reflects a good relationship among prices, volume sold, and direct costs. However, you need to analyze gross margin and the expenses further down to assess whether this profitability turns into operating and net income.
What does a low gross profit mean?
Low gross profit can signal competitive pressure on prices, high direct costs, an unfavorable sales mix, or production inefficiency. When gross profit is not enough to cover operating expenses, the company tends to report low or negative operating and net income. Proper interpretation requires comparison with sector peers and with the company's own history.
What is the ideal value of gross profit?
There is no ideal absolute value of gross profit, because the appropriate amount depends on the company's size, sector, business model, and expense structure. Analysts usually evaluate gross profit together with gross margin and operating profitability ratios, comparing it with direct competitors and with the company's historical trajectory.
Can gross profit be negative?
Yes, gross profit can be negative when the cost of goods sold or services rendered exceeds net sales revenue. This scenario indicates that the company is selling at a negative margin, whether because of insufficient prices, high costs, or a combination of both. Situations like this, when recurring, usually point to an unsustainable business model or a severe operating crisis.
How does gross profit affect a company's valuation?
Gross profit affects valuation mainly through its influence on operating margin and future cash generation. In discounted cash flow models, projections of revenue and gross profit determine the company's ability to cover fixed expenses and generate operating income. In addition, a consistent rise in gross profit and gross margin is often associated with sustainable competitive advantages.