
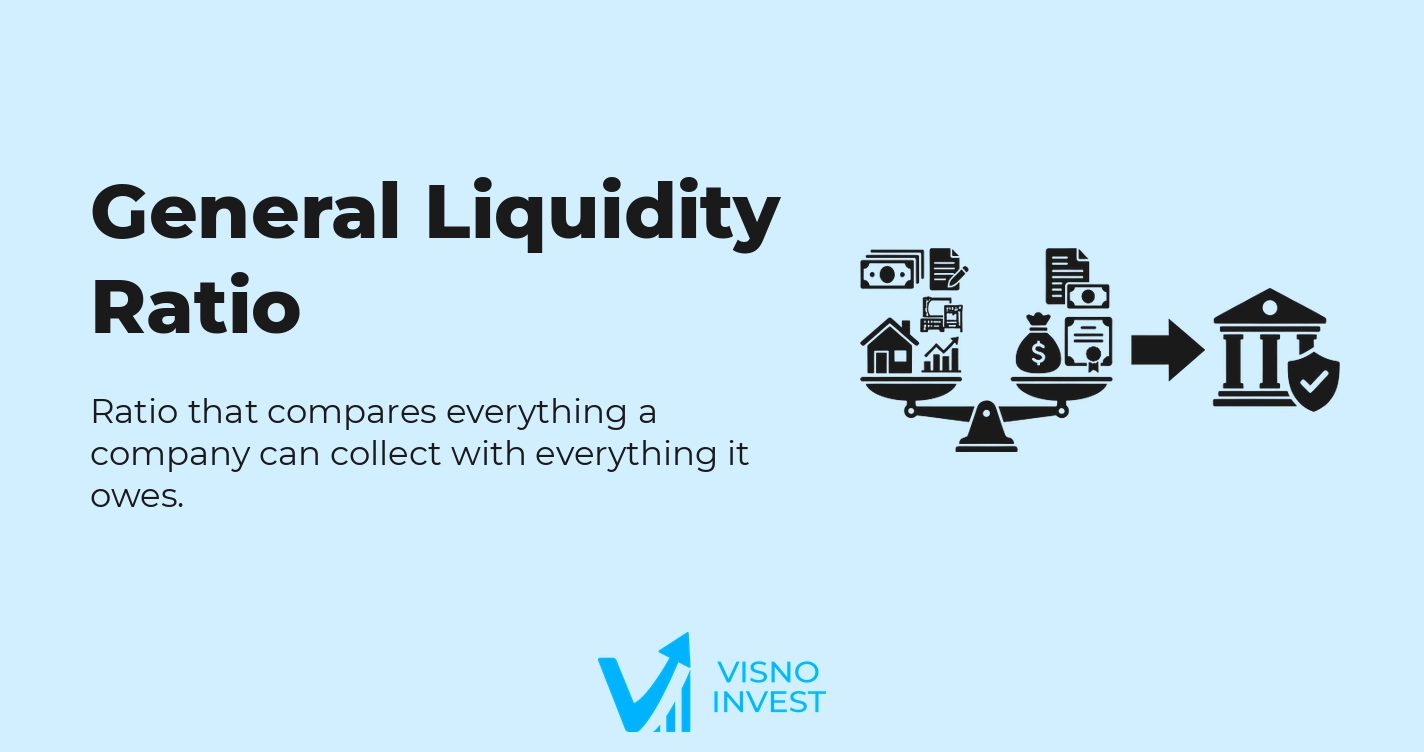
What is the general liquidity ratio?
The general liquidity ratio is a liquidity and solvency indicator that relates all current assets and long-term realizable assets to all current liabilities and long-term liabilities. It measures a company's overall ability to honor short- and long-term debts using its most liquid assets or those realizable over time.
Conceptually, the general liquidity ratio extends liquidity analysis beyond the short-term horizon, incorporating long-term receivables and obligations. While the current ratio focuses only on current assets and current liabilities, the general liquidity ratio takes a broader view of the capital structure, including accounts that will be realized or fall due after twelve months.
The ratio is used in fundamental analysis, credit risk assessment, and capital structure studies to measure economic and financial solvency over an extended horizon. It is particularly relevant for companies with a long operating cycle, a high volume of long-term financing, or significant assets classified as long-term realizable.
In company analysis, the general liquidity ratio helps in understanding repayment capacity in an aggregate scenario, contributing to the assessment of debt sustainability, asset quality, and the match between collection and payment timelines. It is used as a complement to other liquidity, leverage, and profitability ratios.
How the general liquidity ratio works and what its values indicate
The economic logic of the general liquidity ratio rests on weighing the resources that will generate cash inflows in the short and long term against the obligations that will require cash outflows over those same horizons. By aggregating assets and liabilities of different maturities, the ratio seeks to capture the company's structural solvency, not just its immediate financial cushion.
Higher general liquidity values tend to indicate that, in theory, the amount of realizable assets (current and long-term) is sufficient to cover short- and long-term debts. This may reflect a position of lower credit risk, a greater safety margin for creditors, and the potential ability to sustain investment and growth cycles without excessively compromising solvency.
Low general liquidity values, especially below 1.0, may signal that total obligations exceed realizable assets across all maturities. In terms of risk, this suggests greater financial vulnerability, dependence on refinancing, debt rollovers, or a future need to raise equity to rebuild the financial structure.
Interpretation, however, depends on each company's business model and capital structure. Companies with strong recurring operating cash generation and high, predictable margins can sustain lower levels of general liquidity without this representing an immediate risk. In contrast, cyclical businesses with highly volatile earnings tend to require more comfortable ratios to offset operating risk.
The sector context is decisive. Sectors with long-maturing assets (infrastructure, concessions, real estate developers) typically carry significant long-term liabilities financing equally long-term assets, which can put pressure on the general liquidity ratio without necessarily indicating weakness. Working-capital-intensive segments, with a high need to finance inventories and accounts receivable, require analysis together with the current ratio and the quick ratio to avoid mistaken conclusions.
How to calculate the general liquidity ratio
The general liquidity ratio is derived from the balance sheet, calculated from the accounts for current assets, long-term realizable assets, current liabilities, and noncurrent liabilities (long-term liabilities). The standard formula is as follows:
General liquidity ratio = (Current Assets + Long-Term Realizable Assets) ÷ (Current Liabilities + Noncurrent Liabilities )
Current Assets comprise cash, short-term financial investments, accounts receivable, inventories, and other rights expected to be realized within twelve months. Long-Term Realizable Assets include receivables, loans granted, recoverable taxes, judicial deposits, and other assets whose realization period exceeds twelve months.
On the obligations side, Current Liabilities include suppliers, salaries and payroll charges payable, taxes payable, short-term loans and financing, and other obligations due within twelve months. Noncurrent Liabilities refer to long-term debts and provisions, such as long-term financing, debentures, leases, provisions for contingencies, and other obligations that fall due after twelve months.
The data needed to calculate the general liquidity ratio come directly from the balance sheet, generally in consolidated form when analyzing economic groups. There is no dependence on the income statement or the cash flow statement, although those statements are essential for putting the ratio's interpretation in context.
Some analysts make specific adjustments depending on the purpose of the analysis. Assets whose realization is highly uncertain or depends on contingent events may be excluded, certain receivables reclassified, intragroup balances separated out, or adjustments made for discontinued operations. When evaluating companies over several periods, it is also common to standardize accounting criteria across fiscal years to mitigate the effects of changes in standards.
Practical calculation example
Consider a hypothetical company with the following simplified balance sheet (amounts in millions of reais): Current Assets of R$400, Long-Term Realizable Assets of R$300, Current Liabilities of R$350, and Noncurrent Liabilities of R$250. Shareholders' equity is not used directly in calculating the general liquidity ratio.
Applying the formula, we get:
General liquidity ratio = (400 + 300) ÷ (350 + 250) = 700 ÷ 600 ≈ 1.17
A general liquidity ratio of approximately 1.17 indicates that, for every R$1.00 of total debts owed (short and long term), the company has R$1.17 in realizable assets. In terms of extended solvency, there is a moderate safety margin, suggesting that, under current conditions, the set of realizable assets exceeds the set of financial and operating obligations.
In a comparative analysis, suppose companies in the same sector have, on average, a general liquidity ratio of around 1.4, with similar business models and capital structures. In this context, the 1.17 figure could be interpreted as a structural liquidity position slightly tighter than the sector average, calling for closer attention to cash generation capacity and the debt amortization schedule.
Comparison over time is also relevant. If this company's general liquidity ratio had been 1.5 in earlier periods and is on a continuous downward path, this may signal rising indebtedness without a proportional increase in realizable assets, or reclassifications of assets into property, plant and equipment and intangibles, reducing the base of assets considered in the calculation.
Using the general liquidity ratio in company analysis
In practice, the general liquidity ratio is used as a medium- and long-term solvency indicator together with other liquidity, indebtedness, and profitability ratios. In fundamental analysis, it helps assess a company's financial strength, the consistency of its capital structure, and the alignment between asset and liability maturities.
The ratio tends to be more relevant for companies with a high proportion of long-term assets financed by debt, such as infrastructure, energy, water and sanitation, concession, and real estate companies. In these cases, the current ratio alone may look strained, but the general liquidity ratio offers a broader view of structural repayment capacity over time.
On the other hand, in businesses with predominantly current assets and low long-term debt, the general liquidity ratio often approaches the current ratio and adds less incremental information. In these cases, indicators such as the quick ratio, the cash conversion cycle, and operating cash generation can provide more relevant signals for monitoring repayment capacity.
The general liquidity ratio is usually combined with leverage ratios, such as Net Debt/Equity, Net Debt/EBITDA, and the Third-Party Capital Ratio, to form an integrated view of credit risk. It is also analyzed together with operating margins and Return on Equity (ROE), to check whether the company is using debt sustainably to generate returns above its cost of capital.
In valuation processes, the general liquidity ratio can influence assumptions about financial risk, the cost of third-party capital, the likelihood of needing to refinance, and, in extreme cases, insolvency risk. Although it does not directly enter discounted cash flow models, analyzing it helps calibrate scenarios for growth, optimal capital structure, and the probability of liquidity stress in adverse economic cycles.
General liquidity ratio vs. related ratios
General liquidity ratio vs. current ratio
The main difference between the general liquidity ratio and the current ratio is the horizon of analysis. The current ratio considers only current assets and current liabilities, measuring the ability to pay short-term obligations with assets that are also short-term. The general liquidity ratio includes long-term assets and liabilities, widening the focus to overall solvency.
In practice, the current ratio is more often used to assess immediate liquidity risk, especially in sectors with a short operating cycle and high turnover of inventories and receivables. It is a central indicator for analyzing working capital. The general liquidity ratio, in turn, is better suited to assessing the consistency between the asset structure and total debt, also capturing repayment capacity over several fiscal years.
In short-term credit analysis, such as granting credit limits to suppliers, the current ratio tends to carry more weight. In long-term credit assessments, debenture issuances, or structured financing, the general liquidity ratio gains relevance, because it incorporates the impact of long-term contracts, financing, and other future obligations.
General liquidity ratio vs. quick ratio
The quick ratio is a more restrictive indicator that excludes inventories and, in some methodologies, prepaid expenses from current assets. Its goal is to measure short-term repayment capacity using only the most liquid assets, such as cash, financial investments, and accounts receivable. The general liquidity ratio, by contrast, incorporates both inventories and realizable long-term assets, in addition to noncurrent liabilities.
Conceptually, the quick ratio emphasizes immediate liquidity and the quality of very short-term assets, and is particularly useful for companies with slow-moving inventories or obsolescence risk. The general liquidity ratio, in contrast, is less concerned with immediate convertibility and more with the structural fit between realizable assets and total debts, regardless of how fast each component converts.
In practical analysis, the quick ratio is typically adopted in businesses where inventories make up a significant part of assets, such as retail and manufacturing, to assess whether, under stress, it would be possible to meet commitments without depending on the complete sale of inventories. The general liquidity ratio is preferred when the assessment involves long-term commitments, extensive investment projects, and contracts with extended maturities.
General liquidity ratio vs. cash ratio
The cash ratio focuses exclusively on cash on hand (cash and cash equivalents) relative to current liabilities, making it the most conservative short-term liquidity indicator. It shows how many times the company could cover its immediate obligations with available funds alone. The general liquidity ratio, in contrast, is a comprehensive indicator that includes assets and liabilities of all relevant maturities.
While the cash ratio is sensitive to one-off cash movements and short-term management decisions (such as dividend distribution, borrowing, or debt repayment), the general liquidity ratio tends to reflect structural financing and investment decisions. For this reason, the cash ratio is suited to tactical liquidity monitoring, and the general liquidity ratio to strategic solvency diagnostics.
The choice between the ratios depends on the purpose of the analysis. Investors and creditors with very short horizons focus more on the cash ratio and the quick ratio. Financial institutions and long-term credit analysts combine the general liquidity ratio with leverage metrics, interest coverage, and cash generation to form an integrated view of repayment capacity over time.
Advantages and limitations of the general liquidity ratio
Advantages
One of the main advantages of the general liquidity ratio is its breadth. By incorporating short- and long-term assets and liabilities, the ratio provides an integrated view of the company's financial structure, avoiding assessments limited to working capital. This feature is particularly useful in medium- and long-term solvency analyses and in sectors intensive in long-maturing assets.
Another advantage is its simplicity of calculation and understanding. The formula uses consolidated balance sheet groupings that are easy to identify, which supports standardizing analyses across periods and companies. This enables sector comparisons and tracking of historical trends, which are important in risk and capital structure analysis.
The general liquidity ratio is also effective as a preliminary warning indicator. Consistent deterioration over several fiscal years can signal an imbalance between the growth of indebtedness and the build-up of realizable assets, anticipating potential future liquidity pressure. In this way, it helps identify paths of rising risk before actual default problems appear.
Limitations
A relevant limitation of the general liquidity ratio is that it does not distinguish the quality and actual liquidity of the assets considered. Hard-to-collect receivables, slow-moving inventories, or realizable assets that depend on specific conditions can inflate the numerator, suggesting greater solvency than economic reality. For this reason, analyzing the ratio in isolation can lead to incomplete conclusions.
The ratio also ignores the detailed maturity profile of debts. Obligations concentrated in the short term can pose significant risk even if the general liquidity ratio is comfortable, if a large share of realizable assets is allocated to longer maturities or depends on the future completion of projects. The ratio summarizes volumes but does not capture the fine-grained match between collection and payment timelines.
Changes in accounting standards, such as the reclassification of financial assets, the recognition of leases, or changes in measurement criteria, can affect the composition of the assets and liabilities considered in the calculation, making historical comparability difficult. Without consistent adjustments, changes in the general liquidity ratio may reflect accounting effects more than real economic changes.
Nonrecurring events, such as asset disposals, corporate restructurings, or the recognition of large contingencies, can also temporarily distort the general liquidity ratio. Such events can increase or reduce specific assets and liabilities in a given period, affecting the ratio without necessarily representing a sustainable pattern of solvency or long-term risk.
FAQ
What does a high general liquidity ratio mean?
A high general liquidity ratio indicates that total realizable assets, short and long term, comfortably exceed the debts owed over those same horizons. In general, it signals a greater safety margin for creditors and a lower risk of structural insolvency. However, the quality of the assets, cash generation, and the sector context must be evaluated to reach a sound conclusion.
What does a low general liquidity ratio mean?
A low general liquidity ratio, especially below 1.0, suggests that total short- and long-term obligations exceed realizable assets. This may indicate greater financial vulnerability and dependence on refinancing or on raising new funds. How serious the signal is depends on the predictability of cash flow, the debt maturity profile, and the company's financial management practices.
What is the ideal general liquidity ratio?
There is no single ideal general liquidity ratio that applies to all companies. In many contexts, values above 1.0 are considered more comfortable, because they indicate realizable assets greater than total debts. However, the appropriate level varies with each company's sector, business model, earnings volatility, access to credit, and debt policy.
Is a general liquidity ratio above 1 always a good sign?
A general liquidity ratio above 1 generally points to a more favorable structural solvency position, but it does not guarantee the absence of risk. A ratio above 1 is possible with low-quality assets or debts heavily concentrated in the short term. For this reason, the interpretation should consider the composition of assets, the maturity schedule, cash generation, and other complementary financial ratios.
How should the general liquidity ratio be used together with other ratios?
The general liquidity ratio should be analyzed together with the current ratio, the quick ratio, leverage (Net Debt/EBITDA, Net Debt/Equity), and profitability ratios, such as ROE and operating margin. This combination makes it possible to assess solvency, capital structure, and earnings capacity at the same time, offering a more complete view of financial risk and the sustainability of the business.