
What is the current ratio?
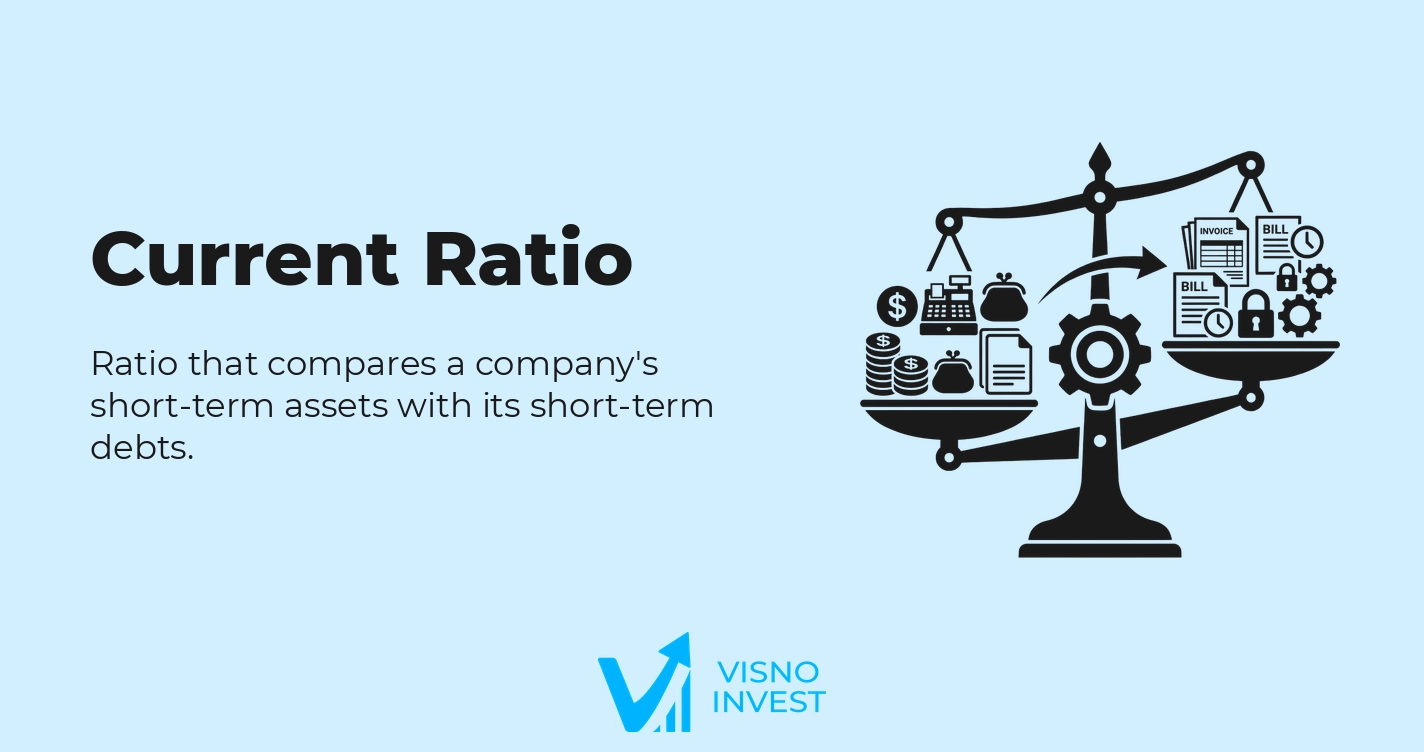
The current ratio is a liquidity ratio that measures a company's ability to meet its short-term obligations using only its current assets. It is calculated as current assets divided by current liabilities and indicates how many times short-term assets cover the debts due over the same time horizon.
The ratio expresses short-term solvency and operating liquidity risk, and is a core metric in credit analysis, financial risk assessment, and capital structure diagnostics. The current ratio helps identify potential cash pressures and dependence on very short-term financing.
In fundamental analysis, the current ratio is part of the set of liquidity, leverage, and profitability ratios used to assess a company's financial quality. Tracking it as a historical series helps detect a gradual deterioration in liquidity, working capital adjustments, and significant changes in financial policy.
Because it is derived directly from the balance sheet, the current ratio provides a concise reading of the short-term capital structure and serves as a starting point for more detailed analyses of working capital, the financial cycle, and refinancing risk.
How the current ratio works and what its values indicate
The current ratio works as a static measure of the relationship between short-term resources and obligations due over the same period. It starts from the premise that current assets will be converted into cash within one operating cycle, while current liabilities will represent cash outlays over the same horizon.
In terms of economic logic, the ratio is directly related to the probability of short-term cash stress. A comfortable relationship between current assets and current liabilities reduces the risk of operating default, forced renegotiation of debt, hasty asset sales, or the need for emergency funding on unfavorable terms.
High current ratio values, generally above 1, indicate that, in theory, short-term assets exceed short-term obligations. This can signal lower liquidity risk, a larger safety margin to withstand shocks in the economic cycle or delays in collections, and less dependence on rolling over debt within a one-year horizon.
On the other hand, very high values may suggest excess working capital tied up in inventories, accounts receivable, or idle cash, potentially reducing the efficiency of capital allocation. In such cases, a high current ratio may reflect conservative management, low operating turnover, or a lack of investment opportunities with an adequate return.
Low current ratio values, especially below 1, indicate that the volume of short-term obligations exceeds current assets. This scenario can increase liquidity risk, demand greater discipline in working capital management, and make the company more sensitive to market shocks, credit tightening, or margin deterioration.
Sector context is decisive in interpreting the ratio. Retail companies with high inventory turnover can operate comfortably with a lower current ratio than long-cycle industrial companies. Public utilities, with predictable revenues, can sustain lower levels compared with cyclical businesses with strong seasonality.
Capital structure and business model also influence the reading. Capital-intensive companies, with heavy investment in noncurrent assets, may show a moderate current ratio but offset it with committed credit lines, robust operating cash flow, and a longer-dated debt profile, reducing the effective liquidity risk.
How to calculate the current ratio
The current ratio calculation is straightforward and uses only balance sheet accounts. The mathematical expression is:
Current Ratio = Current Assets / Current Liabilities
Current assets are the set of assets realizable in the short term, usually within twelve months after the balance sheet date or within the company's operating cycle. They include, among others, cash and cash equivalents, highly liquid financial investments, accounts receivable, inventories, and other short-term receivables.
Current liabilities correspond to obligations due over the same short-term horizon, including suppliers, short-term loans, installments of long-term debt due in the next year, taxes payable, salaries, and other accounts payable. All of these accounts are detailed in the liabilities section of the balance sheet.
The data needed to calculate the current ratio comes directly from the balance sheet published by the company. The basic formula does not require information from the income statement (DRE) or the cash flow statement, although those statements are essential for assessing the cash-generating capacity that supports the liquidity level.
Some analysts make targeted adjustments to current assets and current liabilities to refine the analysis. Common adjustments include: excluding obsolete or hard-to-sell inventories, reclassifying financial assets with low liquidity, separating liabilities related to contingencies, and removing exceptionally distorting items, such as nonrecurring provisions with a low probability of cash outlay in the short term.
Although the current ratio is a point-in-time indicator, calculated at a specific date, analysis often considers quarterly or annual series to capture trends. From that perspective, it is possible to assess the evolution of the ratio alongside investment cycles, changes in customer credit policies, debt renegotiations, and extraordinary events.
Practical calculation example
Consider a Brazilian industrial company with the following simplified balance sheet (amounts in millions of reais): current assets of R$800, made up of cash and cash equivalents of R$150, short-term financial investments of R$100, accounts receivable of R$300, and inventories of R$250. Current liabilities total R$500, consisting of suppliers of R$220, short-term bank loans of R$180, and other liabilities of R$100.
Applying the current ratio formula:
Current Ratio = 800 / 500 = 1.6
The result of 1.6 means that, at the balance sheet date, the company has R$1.60 in short-term assets for every R$1.00 of short-term obligations. In terms of liquidity, the ratio suggests a relatively comfortable position, provided the quality and realizability of the current assets are adequate.
For context, suppose the average current ratio of comparable companies in the same sector is 1.3. In this scenario, the company analyzed shows a liquidity level above the sector average, which may indicate a more conservative working capital policy or lower short-term leverage. On the other hand, it may also represent a larger volume of inventories or accounts receivable, affecting operating efficiency.
In a fundamental analysis, this value of 1.6 is not interpreted in isolation. It would be relevant to look at the composition of current assets (for example, whether there is a concentration in slow-moving inventories), the maturity profile of the obligations in current liabilities, and the operating cash generation capacity to sustain this liquidity level over time.
Using the current ratio in company analysis
The current ratio is widely used in credit analysis, financial risk assessment, and fundamental analysis of both listed and privately held companies. Together with other liquidity ratios, it makes it possible to assess the company's resilience to short-term shocks and its dependence on external sources of financing.
In fundamental analysis, the current ratio is observed alongside ratios such as the quick ratio, cash ratio, debt ratio, interest coverage, and the financial cycle. This combination helps in understanding the relationship among working capital, short-term debt, and operating cash generation.
From a valuation perspective, the current ratio does not enter directly into discounted cash flow models, but it influences assumptions about risk, working capital needs, and any adjustments to operating cash. Companies with structurally weak liquidity may require greater investment in working capital or face a higher cost of capital because of refinancing risk.
The ratio is particularly relevant in specific situations, such as: companies undergoing financial restructuring, companies with unfavorable cash cycles (a long average collection period relative to the average payment period), businesses exposed to strong seasonality, and periods of credit contraction in the financial system.
In situations of lower relevance, the current ratio can be put in perspective when the company has a high consolidated cash balance, robust cash-generating capacity, and recurring access to committed credit lines, which reduces strict dependence on the short-term structure reflected on the balance sheet.
A typical practical application is tracking the current ratio during an intensive investment cycle. In expansion phases, the company may use more working capital and finance part of its needs with short-term debt. The evolution of the ratio, together with the investment schedule and the debt maturity profile, makes it possible to assess whether the strategy is being carried out within risk limits compatible with future cash-generating capacity.
Current ratio vs. related ratios
The current ratio belongs to the family of liquidity ratios, which also includes the quick ratio, cash ratio, and general liquidity ratio. Each offers a distinct perspective on short- and long-term solvency, with differences in the composition of the assets and liabilities considered in the calculation.
Current ratio vs. quick ratio
The quick ratio adjusts the current ratio by excluding inventories from current assets. The logic is to consider only assets that convert to cash more readily in the very short term, such as cash, financial investments, and accounts receivable, eliminating items whose realization may depend on future sales or that are less liquid.
While the current ratio measures the company's overall ability to meet short-term obligations with all current assets, the quick ratio takes a more conservative view of liquidity, assuming that inventories may not be immediately realizable without a loss of value.
In practice, the quick ratio is especially useful in sectors with slow-moving inventories, seasonal products, or obsolescence risk. The current ratio tends to be more representative in businesses with fast inventory turnover and predictable replenishment, such as certain retail segments.
Current ratio vs. cash ratio
The cash ratio is even more restrictive and considers only cash and cash equivalents (and, in some methodologies, highly liquid financial investments) divided by current liabilities. The goal is to measure the company's ability to settle short-term obligations using only immediately available resources.
By comparison, the current ratio takes in a broader set of short-term assets, including inventories and accounts receivable, offering a more comprehensive view of the liquidity position. The cash ratio, in turn, focuses on the instantaneous safety margin, disregarding the steps needed to realize assets.
The cash ratio tends to be used more in very conservative solvency analyses or for companies subject to abrupt shocks to confidence or credit. The current ratio remains the reference metric for standard liquidity assessment, complemented by the cash ratio in cases that call for greater rigor.
Current ratio vs. general liquidity ratio
The general liquidity ratio extends the time horizon of the ratio by taking, in the numerator, current assets plus long-term receivables and, in the denominator, current liabilities plus noncurrent liabilities. The general liquidity ratio thus seeks to assess the overall ability to settle total obligations with assets realizable over all time horizons.
While the current ratio focuses exclusively on short-term solvency, aligned with the operating cycle and the one-year period, the general liquidity ratio incorporates long-term debts and assets, approaching a structural solvency analysis. They are therefore complementary ratios with distinct horizons.
In credit analysis contexts, the current ratio is used more to assess immediate refinancing risk, while the general liquidity ratio supports the assessment of long-term financial sustainability and the ability to honor structural debt.
Advantages and limitations of the current ratio
Advantages
The main advantage of the current ratio is the simplicity of calculation and interpretation. The ratio uses standardized balance sheet information available in any financial statement, which allows broad application across companies of different sizes and makes comparisons across companies and periods easier.
From an analytical standpoint, the current ratio offers an immediate view of the balance between working capital and short-term liabilities. It is useful for initial screening of liquidity risk, identifying potential stress scenarios, and detecting abrupt changes in short-term financing policy.
Another advantage is its ability to be integrated with other financial ratios. The current ratio can be analyzed together with operating margin, inventory turnover, and average collection and payment periods, allowing more complete diagnoses of operating efficiency, capital structure, and working capital needs.
In addition, the ratio is widely known and used by analysts, financial institutions, and market participants, which favors its adoption in credit models, financial covenants, and standardized sector benchmarks.
Limitations
A significant limitation of the current ratio is its strictly static nature. The ratio reflects the position of current assets and liabilities at a specific date, without fully capturing the dynamics of cash flows over the period, which can hide seasonality or intense short-term swings.
The quality of current assets is not explicitly considered in the calculation. Obsolete inventories, hard-to-collect accounts receivable, or receivables subject to disputes can inflate current assets, artificially raising the current ratio without a corresponding real improvement in payment capacity.
Regulatory changes and accounting standards, such as the adoption of IFRS, can change the classification of certain assets and liabilities between current and noncurrent, affecting historical comparability. Reclassifications of debt and financial assets can also cause changes in the ratio without any real change in the liquidity position.
Nonrecurring events, such as capital contributions, asset sales, or extraordinary liquidation of inventories, can significantly affect current assets or current liabilities in a specific period, distorting the reading of the current ratio if there is no adequate adjustment or context.
Finally, the current ratio does not directly incorporate relevant qualitative elements, such as access to committed credit lines, banking relationships, the ability to roll over debt, and flexibility in managing investments. These factors can mitigate liquidity risk even when the accounting ratios are tighter.
FAQ
What does a high current ratio mean?
A high current ratio indicates that current assets comfortably exceed current liabilities, suggesting a greater ability to pay short-term obligations. In general, it reflects lower liquidity risk, but it may also indicate excess working capital, high inventories, or idle cash, which can reduce the efficiency with which resources are used.
What does a low current ratio mean?
A low current ratio, especially below 1, means that short-term obligations exceed short-term assets. This increases the risk of cash stress, requiring rigorous working capital management and, often, greater dependence on bank credit or renegotiation of terms with suppliers and financial creditors.
What is the ideal current ratio?
There is no single ideal current ratio that applies to all sectors. In many cases, values above 1 are considered more comfortable, but the appropriate level depends on the business model, the operating cycle, the degree of revenue predictability, and the company's access to credit and alternative sources of liquidity.
What is the difference between the current ratio and the quick ratio?
The current ratio takes all current assets in the numerator, including inventories. The quick ratio excludes inventories, focusing only on assets that convert more readily to cash, such as cash, financial investments, and accounts receivable. The quick ratio is more conservative and more relevant in sectors with illiquid inventories or obsolescence risk.
How should the current ratio be used to compare companies?
When comparing companies, the current ratio should be assessed among companies in the same sector or with similar business models. It is advisable to look at sector averages and historical series and to combine the ratio with metrics such as inventory turnover and collection and payment periods, in addition to qualitatively analyzing the quality of current assets.