
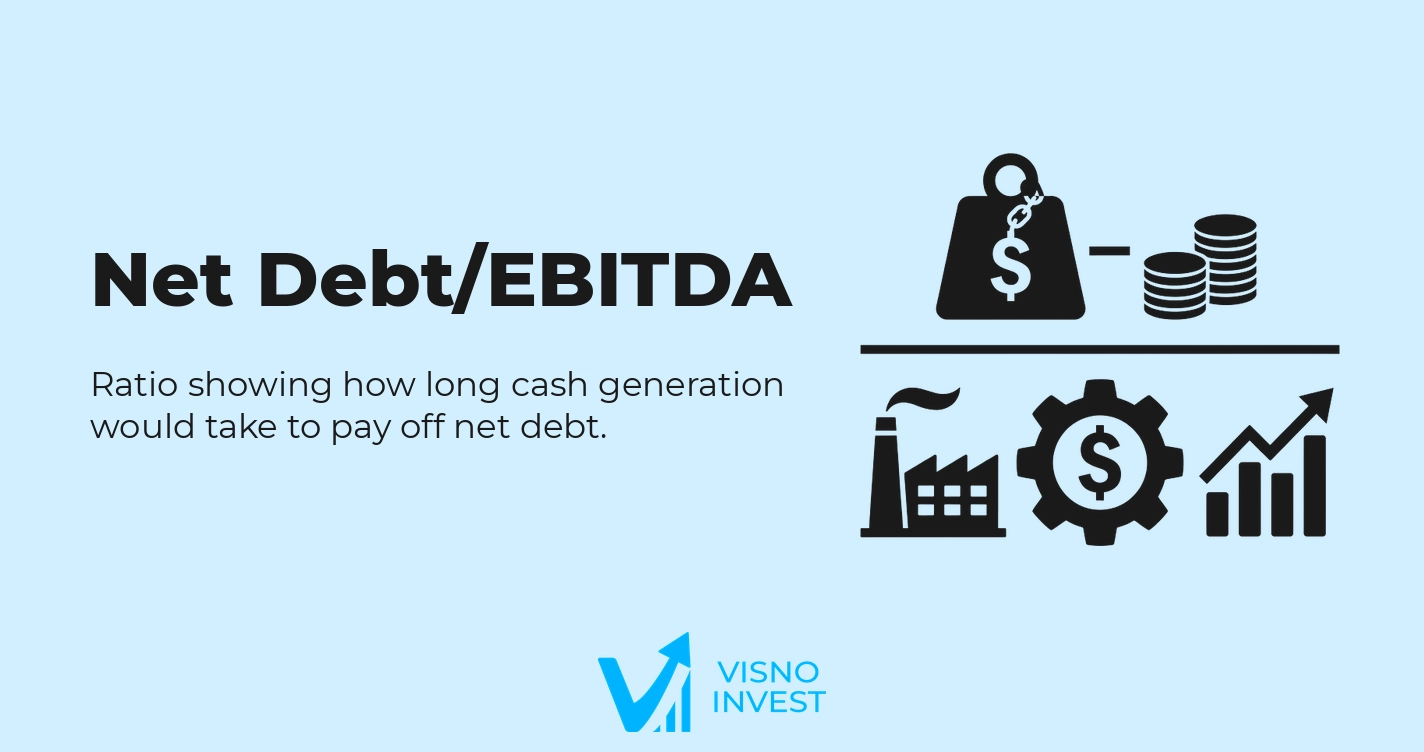
What is Net Debt/EBITDA?
The Net Debt/EBITDA indicator measures how many years a company would theoretically need to pay off its net debt using the EBITDA it generates, holding operating results and indebtedness constant. It is a financial leverage multiple widely used in credit analysis, risk assessment, and capital structure analysis.
Conceptually, net debt is gross financial debt minus cash and cash equivalents, while EBITDA approximates the company's recurring operating cash flow before interest, taxes, depreciation, and amortization. The ratio between the two indicates the business's ability to repay its debt.
The Net Debt/EBITDA indicator is used in fundamental analysis to assess solvency, the sustainability of leverage, resilience in adverse economic cycles, and financial headroom for investments or distributions to shareholders. It is also a recurring parameter in debt covenants and in corporate credit rating assessments.
Because it condenses financial risk into a single number and allows comparisons across companies and over time, the multiple has become a reference in capital structure analysis, complementing metrics such as Net Debt/Equity, Interest Coverage, and Operating Cash Flow/Debt.
How Net Debt/EBITDA works and what its values indicate
The Net Debt/EBITDA indicator is based on the relationship between the stock of net debt and the operating capacity to generate cash. The numerator expresses the financial obligation to be honored in the future; the denominator, the main internal source of funds for paying down those commitments over time.
The economic logic is as follows: the larger the net debt for a given level of EBITDA, the larger the share of operating income that must go to interest and principal payments, reducing room for investments, working capital, acquisitions, or dividend distributions. Consequently, a high multiple indicates greater financial risk, greater sensitivity to interest rates, and lower resilience to earnings shocks.
On the other hand, a low Net Debt/EBITDA suggests that the company has moderate debt relative to its potential to generate operating cash. This tends to mean greater financial flexibility, the ability to absorb declines in revenue or margins, and room to finance organic or inorganic growth without putting excessive pressure on credit risk.
The values of the multiple also reflect the business model and the target capital structure. Asset-intensive sectors with stable revenues and long-term contracts can operate comfortably with a higher Net Debt/EBITDA. Cyclical segments with volatile margins, by contrast, tend to require more conservative leverage to keep risk at appropriate levels.
Technical interpretation requires contextual analysis. The same Net Debt/EBITDA level can be conservative in a regulated sector with predictable revenues and, at the same time, risky in a highly cyclical sector. Information on average debt maturity, financial cost, the quality (recurrence) of EBITDA, and investment needs complements the reading of the indicator.
How to calculate Net Debt/EBITDA
Calculating the Net Debt/EBITDA ratio is straightforward, but it depends on consistent definitions for each component and a correct reading of the financial statements. The standard formula is:
Net Debt/EBITDA = Net Debt / EBITDA
Net debt generally corresponds to the sum of short- and long-term gross debt (loans, financing, debentures, finance leases, and other interest-bearing liabilities) minus cash and cash equivalents. This information is obtained from the balance sheet, in the current and noncurrent financial liabilities lines and in current assets.
EBITDA is derived from the income statement. In its simplest form, it can be approximated by:
EBITDA = Operating Income (EBIT) + Depreciation + Amortization
Some companies report EBITDA directly in their filings, often with management adjustments. When they do not, depreciation and amortization are usually found in the notes to the financial statements or on the income statement itself, allowing reconciliation with operating income. It is essential to use recurring EBITDA, excluding unusual effects when the analysis calls for an assessment of structural risk.
Analysts usually use EBITDA for the last twelve months (LTM/TTM) to avoid seasonal distortions and capture the company's most recent performance. In some cases, additional adjustments are made to exclude nonrecurring items (one-off gains or losses, restructurings, impairment tests, among others), seeking to reflect normalized cash-generating power.
Adjustments can also be made to net debt, such as including capitalized operating leases, updating hybrid instruments, and excluding restricted cash that is not available to repay debt. These adjustments depend on technical judgment and should be applied consistently over time and across comparable companies.
Practical example of the calculation
Consider a company that, at fiscal year-end, reports the following accounting figures (in millions of reais): short-term debt of R$300, long-term debt of R$1,700, and cash and cash equivalents of R$400. On the consolidated income statement for the last twelve months, operating income (EBIT) was R$600, depreciation totaled R$150, and amortization R$50.
First, net debt is calculated:
- Total gross debt = R$300 (short term) + R$1,700 (long term) = R$2,000
- Cash and cash equivalents = R$400
- Net debt = R$2,000 − R$400 = R$1,600
Next, EBITDA is calculated from the income statement:
- EBIT = R$600
- Depreciation = R$150
- Amortization = R$50
- EBITDA = R$600 + R$150 + R$50 = R$800
Applying the multiple's formula:
Net Debt/EBITDA = R$1,600 / R$800 = 2.0x
The result of 2.0 times indicates that, holding the current level of EBITDA constant and disregarding investments, taxes, and interest, the company would take approximately two years to fully pay off its net debt. In a stable sector, this level may be consistent with moderate leverage; in a more volatile sector, it may call for a more cautious assessment.
Assuming that similar companies in the same segment operate with a Net Debt/EBITDA of around 1.0x to 1.5x, the 2.0x multiple signals leverage above the sector average. This can influence perceptions of credit risk, cost of capital, and resilience in stress scenarios, although the final assessment depends on the quality of EBITDA, the amortization schedule, and the track record of financial management.
Using Net Debt/EBITDA in company analysis
The Net Debt/EBITDA indicator is used routinely to assess financial leverage and corporate credit risk. In fundamental analysis, it serves as a summary metric of the relationship between net indebtedness and operating cash-generating capacity, supporting judgments about the sustainability of the capital structure over the medium and long term.
When credit lines are granted or renewed, the multiple is often monitored as a financial covenant. Debt contracts may set maximum limits on Net Debt/EBITDA, the breach of which leads to renegotiations, acceleration of maturities, or additional restrictions. For this reason, deleveraging or releveraging trajectories are closely watched by creditors and investors.
In the analysis of listed companies, the indicator is combined with profitability and efficiency metrics such as Return on Equity (ROE), Return on Invested Capital (ROIC), operating margins, and free cash flow generation. High leverage can be acceptable when paired with returns above the cost of capital and highly predictable results.
In valuation, Net Debt/EBITDA helps define capital structure and cost of debt scenarios for discounted cash flow (DCF) models. It is also used in comparisons with peers (the peer group) to assess whether a company's leverage level is in line with sector practices and the intrinsic risks of the business.
The indicator is most relevant for mature companies with stabilized EBITDA and lower earnings volatility. For early-stage companies, those in a heavy investment cycle, or those with still-negative or highly volatile EBITDA, the multiple loses explanatory power and should be complemented by analysis of the projected capital structure, the investment schedule, and future funding sources.
Net Debt/EBITDA vs. related indicators
The Net Debt/EBITDA multiple is part of a set of leverage, coverage, and capital structure indicators. Understanding how it differs from related metrics allows a fuller reading of corporate financial risk and of the ability to create value for the shareholder.
Net Debt/EBITDA vs. Net Debt/Equity
The Net Debt/Equity ratio (also known as the debt-to-equity ratio or gearing) compares net debt with the shareholders' equity recorded on the balance sheet. It is a capital structure measure that expresses the degree of debt financing relative to shareholders' capital.
While Net Debt/EBITDA relates debt to operating cash-generating capacity, Net Debt/Equity relates debt to the accounting base of shareholders' equity. The former is dynamic and sensitive to operating performance; the latter is more static and tied to the long-term financing mix.
In practical terms, Net Debt/EBITDA is more often used to assess debt service sustainability, while the ratio to equity assesses the degree of structural leverage. Companies can show a low Net Debt/Equity but a high Net Debt/EBITDA if EBITDA is temporarily depressed, and vice versa.
In practice, the two are complementary: a combination of a high Net Debt/EBITDA and a high Net Debt/Equity tends to indicate more pronounced financial risk, especially when earnings are under pressure. Moderate leverage on both metrics, on the other hand, suggests a more conservative capital structure.
Net Debt/EBITDA vs. Interest Coverage
The Interest Coverage indicator measures how many times operating income (usually EBIT or EBITDA) covers a company's net financial expense. A common example is the EBIT/Financial Expense ratio, which evaluates how much headroom operating income leaves for paying interest.
While Net Debt/EBITDA focuses on the stock of debt relative to operating cash generation, Interest Coverage focuses on the flow of financial expenses relative to operating income. The former is more closely associated with the implied duration of the debt; the latter, with the immediate ability to meet recurring interest payments.
In a practical comparison, companies with a similar Net Debt/EBITDA can have different risk profiles if the average interest rate is very different. A company with more expensive debt will have lower interest coverage, even with equivalent leverage in terms of EBITDA. Solvency analyses therefore often combine both indicators to capture the volume and the cost of debt.
Net Debt/EBITDA is especially useful for assessing deleveraging trajectories over several years, while Interest Coverage is more sensitive to changes in interest rates, the structure of indexers, and one-off changes in financial expenses over shorter horizons.
Net Debt/EBITDA vs. Operating Cash Flow/Debt
The Operating Cash Flow/Debt ratio relates the cash flow generated by operations (usually taken from the cash flow statement) to the amount of gross or net debt. It is a measure directly aligned with actual cash generation, already reflecting changes in working capital and noncash items.
Net Debt/EBITDA has the advantage of being more stable, since it is based on an operating result before the effects of working capital and certain accounting adjustments. However, it can diverge substantially from actual cash flow in years of heavy consumption or release of working capital, or in businesses with a large mismatch between accrual accounting and cash.
In practice, the Net Debt/EBITDA indicator is widely used for its simplicity and comparability across companies and sectors. Operating Cash Flow/Debt, in turn, tends to be preferred in repayment-capacity analyses focused heavily on liquidity and actual cash generation, especially in sectors with high working capital volatility.
Using the two indicators together makes it possible to check whether recurring EBITDA is being converted into cash at a pace consistent with the debt structure. Persistent divergences between the two can signal additional risks not captured by Net Debt/EBITDA alone.
Advantages and limitations of Net Debt/EBITDA
Advantages
One of the main advantages of the Net Debt/EBITDA indicator is the simplicity of its calculation and interpretation. The formula uses figures widely available in the financial statements, which makes it easy to apply across different companies, segments, and historical periods, allowing structured comparisons of leverage.
Another advantage is its focus on operating cash flow. By using EBITDA instead of net income or equity, the multiple more directly captures the business's economic capacity to generate funds to honor its debt, reducing the impact of noncash accounting items and of specific corporate structures.
Net Debt/EBITDA is also useful as a metric for tracking over time. Rising or falling trajectories of the multiple summarize leverage movements, changes in capital policy, investment cycles, and discipline in generating earnings, supporting the identification of trends of improving or deteriorating financial risk.
In addition, the indicator is widely used in financing agreements and in rating analyses, which creates a common language among companies, creditors, and investors. This facilitates dialogue about deleveraging targets, debt limits, and the conditions for maintaining credit lines.
Limitations
A relevant limitation of Net Debt/EBITDA is its sensitivity to one-off changes in EBITDA. In periods of a temporary drop in earnings, the multiple can rise significantly even without an increase in debt, suggesting a deterioration in risk that may be transitory. Conversely, exceptionally strong years can push the indicator below a level that is sustainable over the long term.
Another constraint is that EBITDA does not represent available cash flow. The indicator does not account for investment needs in fixed capital (CAPEX), changes in working capital, cash tax payments, or other commitments that consume operating resources ahead of debt service. As a result, the multiple can overstate actual repayment capacity in CAPEX-intensive businesses or those with highly volatile working capital.
Changes in accounting standards, such as the introduction of lease accounting rules (for example, lease capitalization), can alter both the composition of debt and EBITDA levels at the same time, changing historical comparability. Without consistent adjustments, time series may suggest changes in leverage that mainly reflect a change in accounting criteria, not a real economic change.
The indicator is also less informative for companies with very low or negative EBITDA, a common situation in early-stage, turnaround, or highly cyclical businesses. In these cases, the multiple tends toward infinity or loses meaning, requiring other metrics, such as liquidity analysis, the maturity schedule, cash reserves, and the ability to access new sources of financing.
Finally, Net Debt/EBITDA does not reflect the debt maturity structure. Companies with the same multiple can have different risk profiles if one has debt concentrated in the short term and the other has well-staggered long-term financing. Reading the indicator properly therefore requires looking at it together with information on average maturity, indexers, and collateral.
FAQ
What does a high Net Debt/EBITDA mean?
A high Net Debt/EBITDA indicates that the level of net debt is high relative to operating cash-generating capacity. In practical terms, it suggests greater financial risk, greater sensitivity to rising interest rates, and less flexibility to invest or distribute earnings, calling for careful analysis of maturity, cost of debt, and the stability of EBITDA.
What does a low Net Debt/EBITDA mean?
A low Net Debt/EBITDA signals relatively moderate debt compared with the EBITDA generated. This tends to indicate more headroom to pay down debt, the ability to absorb negative earnings shocks, and room to finance growth. However, what counts as "low" depends on the sector, the predictability of earnings, and investment needs.
What is the ideal Net Debt/EBITDA?
There is no universal ideal value for Net Debt/EBITDA. Ranges considered comfortable vary with the sector, earnings volatility, capital intensity, and regulatory profile. Stable segments can operate with higher multiples, while cyclical sectors call for more conservative leverage. The analysis should also consider the amortization schedule and expected free cash flow generation.
How does Net Debt/EBITDA affect the cost of capital?
Higher levels of Net Debt/EBITDA tend to raise the perception of credit risk, which can result in a higher cost of debt, wider spreads, and more restrictive contractual terms. This affects the weighted average cost of capital (WACC) and, consequently, valuation. Lower multiples, by contrast, favor more competitive financing terms, as long as they do not imply underuse of leverage capacity.
Is it better to analyze historical or projected Net Debt/EBITDA?
Historical Net Debt/EBITDA is useful for understanding past leverage behavior and the company's financial discipline. The projected indicator, in turn, is essential for assessing the future sustainability of the capital structure, taking into account investment plans, margin changes, and dividend policy. Complete analyses combine both, looking at the historical trajectory and at deleveraging or releveraging targets.