
Definition and importance of the balance sheet
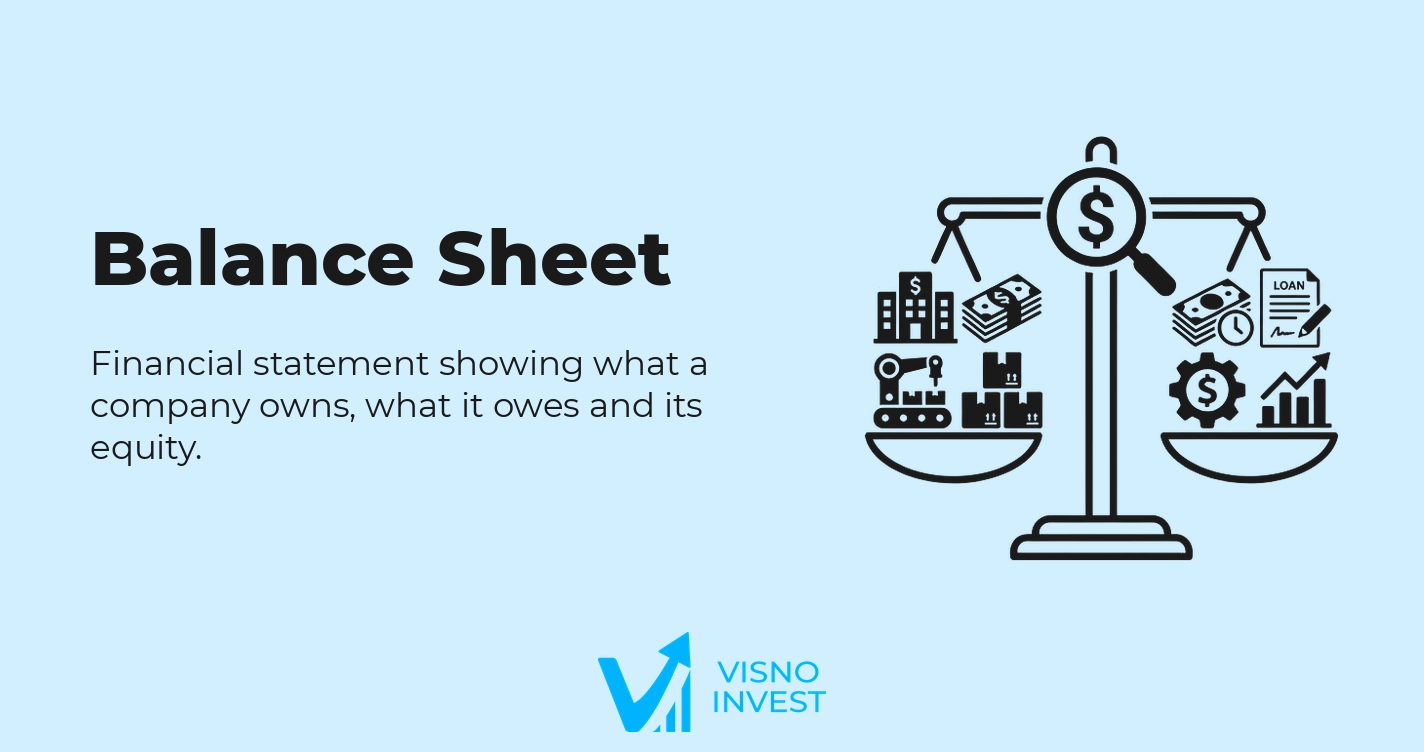
The balance sheet is the financial statement that presents a company's financial position at a specific date, detailing its assets, liabilities, and shareholders' equity. In fundamental analysis of stocks, the balance sheet is the basis for measuring liquidity, solvency, leverage, and the ability to create value for shareholders.
What the ratios derived from the balance sheet have in common is that they use only balance sheet accounts, such as current assets, current liabilities, financial debt, working capital, and shareholders' equity. These ratios are analyzed together to assess the quality of the capital structure, financial risk, and the consistency of the equity base that supports the company's results.
Within fundamental analysis of stocks, the balance sheet is especially relevant for studies of capital structure, liquidity analysis, credit risk assessment, determination of book value per share, and long-term solvency analysis. It is also the main source for calculating book value multiples and for reconciling market cap with book value.
Overview of balance sheet ratios
The ratios derived from the balance sheet can be grouped into four main blocks: liquidity, capital structure and debt, working capital, and book value ratios. Each group uses different combinations of assets, liabilities, and shareholders' equity to answer specific questions about the company's risk, solvency, and financial strength.
Current ratio
The current ratio measures the company's ability to meet its short-term obligations using its short-term assets. It compares current assets to current liabilities and is one of the most widely used ratios for assessing operating liquidity risk.
Current Ratio = Current Assets / Current Liabilities
Its main use is to indicate whether short-term working capital is sufficient to support the operating cycle, considering inventories, accounts receivable, and obligations to suppliers and other short-term debt.
Quick ratio
The quick ratio refines the current ratio analysis by excluding inventories from current assets, since they are generally less liquid and more prone to losing value. It focuses on the assets that convert to cash fastest, such as cash and accounts receivable.
Quick Ratio = (Current Assets − Inventories) / Current Liabilities
It is used to assess short-term payment capacity in more conservative scenarios, in which the sale of inventories is not assumed to be immediate or complete.
Cash ratio
The cash ratio considers only cash and cash equivalents against current liabilities. It is the most restrictive form of liquidity analysis, entirely focused on resources immediately available for payment.
Cash Ratio = Cash and Cash Equivalents / Current Liabilities
Its main use is to assess very short-term liquidity reserves, which is especially relevant for companies with highly volatile cash flows or exposure to liquidity shocks.
General liquidity ratio
The general liquidity ratio extends the time horizon of liquidity by including long-term assets and liabilities. It combines current assets and long-term receivables with current liabilities and long-term liabilities.
General Liquidity Ratio = (Current Assets + Long-Term Receivables) / (Current Liabilities + Long-Term Liabilities)
It is used to assess overall solvency, also taking long-term receivables and obligations into account, and complements the view provided by the current ratio.
Net working capital
Net working capital measures the surplus (or deficit) of long-term funds invested in current assets. It represents the short-term operating financial cushion.
Net Working Capital = Current Assets − Current Liabilities
It is used to assess whether the company finances its operating cycle mainly with long-term or short-term funds, which influences refinancing risk and cash stress.
Working capital requirement (WCR)
The working capital requirement compares short-term operating investments with short-term operating financing. It focuses on the items directly tied to operations, such as inventories, customers, and suppliers.
Working Capital Requirement ≈ (Inventories + Accounts Receivable) − Operating Accounts Payable
It is used to assess how much the operation consumes or generates in cash in the short term and how the management of purchasing, production, and sales terms affects financial balance.
Cash position (or treasury balance)
The cash position, often analyzed as the treasury balance, compares net working capital with the working capital requirement, or directly compares cash with short-term obligations.
Treasury Balance ≈ Net Working Capital − Working Capital Requirement
Its main use is to measure the structural cash cushion or deficit, indicating whether the company depends on short-term financing to sustain its operations.
Total debt ratio
The total debt ratio measures the relationship between interest-bearing liabilities and shareholders' equity or total assets. It can be expressed in different configurations, depending on the focus of the analysis.
Total Debt Ratio = Interest-Bearing Liabilities / Shareholders' Equity
It is used to assess the degree of financial leverage, credit risk, and the dependence on third-party capital in the capital structure.
Short-term debt ratio
The short-term debt ratio focuses on financial debt that matures within twelve months. It makes it possible to measure refinancing risk and short-term cash pressure.
Short-Term Debt Ratio = Short-Term Financial Debt / Total Financial Debt
Its main use is to assess the concentration of maturities in the short term and the company's vulnerability to changes in credit conditions.
Gross debt
Gross debt represents total financial obligations, short- and long-term, before deducting cash. It normally includes loans, financing, debentures, and other debt instruments.
Gross Debt = Short-Term Financial Debt + Long-Term Financial Debt
It is used as the basis for leverage ratios, capital profile analysis, and assessing debt service capacity alongside cash generation metrics.
Net debt
Net debt adjusts gross debt for cash and cash equivalents. It represents the effective debt after considering the highly liquid resources available for repayment.
Net Debt = Gross Debt − Cash and Cash Equivalents
It is the standard ratio for assessing net leverage and is often combined with earnings and operating cash metrics in fundamental analysis.
Third-party capital ratio
The third-party capital ratio measures the weight of liabilities relative to the company's own funds. It relates liabilities to shareholders' equity to indicate the degree of dependence on creditors.
Third-Party Capital Ratio = Total Liabilities / Shareholders' Equity
Its main use is to assess the strength of the capital structure and the equity safety margin available to absorb losses.
Equity immobilization
Equity immobilization assesses how much of shareholders' equity is invested in noncurrent assets, especially fixed and intangible assets that are hard to convert into cash.
Equity Immobilization = Noncurrent Assets / Shareholders' Equity
It is used to analyze how rigid the asset structure is and how much of the company's own funds is available to finance working capital.
Debt composition
Debt composition analyzes how debt is distributed between short and long term and, in some cases, between interest-bearing and non-interest-bearing debt. It complements the total debt ratios.
Debt Composition = Short-Term Debt / Total Debt
Its use is to assess whether the maturity profile of the obligations fits the company's cash generation and investment profile.
Book value (shareholders' equity) and book value per share
Book value corresponds to accounting shareholders' equity, that is, the difference between assets and liabilities. Book value per share relates that amount to the number of shares issued.
Book Value = Shareholders' Equity
Book Value per Share = Shareholders' Equity / Number of Shares
They are used to compare book value with market value, to support the calculation of the Price-to-Book (P/B) multiple, and to assess how the equity base evolves over time.
How to use balance sheet ratios together
Using the balance sheet ratios together makes it possible to build an integrated view of the company's financial situation, covering liquidity, capital structure, leverage, and the strength of shareholders' equity. In fundamental analysis of stocks, these ratios work as complementary layers for assessing risk and supporting long-term value.
The first layer is usually liquidity analysis, combining the current ratio, quick ratio, and cash ratio. Together, these ratios indicate whether current assets are sufficient to cover current liabilities and how good that coverage is. A high current ratio with low quick and cash ratios can signal excessive dependence on inventories or low cash availability.
In the second layer, the focus falls on net working capital, the working capital requirement, and the treasury balance. How these ratios interact shows whether the short-term financing structure fits the operating cycle. Positive net working capital that is lower than the working capital requirement tends to indicate the use of short-term debt and greater sensitivity to credit shocks.
The third layer addresses capital structure and debt. A combined analysis of the total debt ratio, gross debt, net debt, the short-term debt ratio, debt composition, and the third-party capital ratio makes it possible to assess the level and profile of financial leverage. Moderate net debt with a high third-party capital ratio may indicate heavy use of operating liabilities, but not necessarily an excess of interest-bearing debt.
These debt ratios should be weighed against liquidity and working capital. High short-term debt, combined with a low cash ratio and a negative treasury balance, tends to signal greater refinancing risk. On the other hand, long-term debt, with a comfortable current ratio and robust net working capital, can be consistent with long-term investment strategies.
Equity immobilization and the third-party capital ratio complement this view by indicating how rigid the assets are and how much equity room the company has to maneuver. High equity immobilization, combined with a high third-party capital ratio, reduces financial flexibility and limits the company's ability to withstand adverse cycles without issuing new equity or taking on more debt.
Book value and book value per share connect the balance sheet to market valuation. When analyzed alongside multiples such as Price-to-Book (P/B), they allow book value to be compared with the value the market assigns. This comparison becomes more robust when integrated with solvency, liquidity, and leverage ratios, making it possible to judge whether a discount or premium to book value is consistent with the underlying financial risk.
In sector terms, the interpretation of the set of balance sheet ratios varies significantly. Retail and consumer goods companies tend to operate with significant inventories and shorter cash cycles, which makes analysis of the working capital requirement and the quick ratio particularly important. In capital-intensive industrial sectors, equity immobilization is usually higher, requiring closer attention to the long-term financing structure.
For infrastructure, utilities, and concession companies, the emphasis falls on gross debt, net debt, debt composition, and the general liquidity ratio, given the predominance of long-term projects and more stable cash flows. For technology and service companies, with less physical immobilization, the focus tends to be the balance among working capital, debt, and cash position, as well as the quality of intangible assets, even though not all of them are fully reflected on the balance sheet.
In fundamental analysis of stocks, balance sheet ratios are also integrated with performance and profitability ratios, such as Return on Equity (ROE) and Return on Invested Capital (ROIC). The combination makes it possible to assess whether the capital structure and the level of debt are compatible with the profitability generated and with the ability to reward shareholders sustainably.
Finally, dynamic analysis, comparing historical series of liquidity, debt, working capital, and book value, is essential to identify trends of strengthening or deterioration in the financial structure. Consistent increases in net debt, reductions in net working capital, and a rising third-party capital ratio, without a corresponding growth in shareholders' equity or productive assets, can indicate a gradual increase in financial risk.
Limitations of balance sheet ratios
The ratios derived from the balance sheet have specific limitations because they are based on accounting values recorded at a single point in time. The balance sheet reflects a static snapshot and, on its own, does not capture cash generation dynamics, operating seasonality, or significant events that occur just after the reference date.
The accounting measurement of assets and liabilities can introduce significant distortions in the ratios. Assets recorded at historical cost, without frequent updates to fair value, can understate or overstate their true economic value. Provisions, contingencies, and depreciation and amortization policies also affect shareholders' equity and, consequently, book value and equity immobilization.
The current ratio, quick ratio, and cash ratio can be influenced by one-off period-end moves, such as accelerating receivables, postponing payments, or temporary short-term borrowing. These effects can artificially improve the ratios on the balance sheet date without reflecting the company's typical liquidity throughout the year.
Debt ratios, such as gross debt, net debt, the third-party capital ratio, and debt composition, depend on the proper classification of obligations between short and long term and on the correct identification of interest-bearing debt. Accounts payable transactions, leases, guarantees, and complex financial instruments may not be fully disclosed in the traditional liability lines, which affects how leverage is read.
Book value and book value per share do not fully reflect unrecognized intangible assets, such as human capital, unregistered brands, or technological know-how. In intangible-intensive sectors, this can lead to significant gaps between book value and actual earning power, limiting the use of book value on its own in valuation models.
In addition, differences in accounting practices, account reclassifications, and changes in standards can affect comparability over time and across companies. Without proper adjustments, comparisons of liquidity, debt, and working capital may reflect differences in accounting policy more than real economic differences.
Frequently asked questions about the balance sheet
What is the difference between the balance sheet and the income statement?
The balance sheet presents the company's financial position at a specific date, detailing assets, liabilities, and shareholders' equity. The income statement (DRE), in turn, shows performance over a period, presenting revenues, costs, expenses, and profit. The balance sheet focuses on a stock of resources; the income statement, on a flow of results over time.
How is the balance sheet used in fundamental analysis of stocks?
In fundamental analysis of stocks, the balance sheet is used to assess liquidity, solvency, capital structure, leverage, and the quality of the equity base. From it, ratios such as the current ratio, net debt, the third-party capital ratio, and book value per share are calculated, which complement the analysis of earnings and cash flows.
Why is net debt used more than gross debt?
Net debt takes gross debt adjusted for cash and cash equivalents, reflecting the effective financial position after the potential use of cash for repayment. This adjustment makes it possible to compare companies with different levels of cash and financial investments and offers a more accurate view of real financial leverage than gross debt alone.
Does book value per share indicate a company's "fair value"?
Book value per share is accounting shareholders' equity divided by the number of shares, but it does not necessarily correspond to fair economic value. It does not fully capture intangible assets, growth prospects, specific risks, or operating efficiency. For that reason, it is usually used together with other ratios and valuation methods.
Is a high current ratio always a good thing?
A high current ratio indicates, in principle, a greater ability to meet short-term obligations. However, excessively high levels can signal idle working capital, high inventories, or poor allocation of resources. A proper interpretation requires combining the current ratio with the quick ratio, cash ratio, working capital requirement, and a qualitative analysis of the composition of current assets.
Can balance sheets of companies in different sectors be compared directly?
Direct comparisons are limited, since each sector has its own typical asset structures, cash cycles, and debt levels. Companies that are intensive in fixed capital tend to have higher equity immobilization and long-term debt, while service sectors can operate with less working capital. The analysis should take sector characteristics and business models into account.
How does the balance sheet relate to cash flow?
The balance sheet shows balances at a specific date, while the cash flow statement explains the changes in those balances over the period. Changes in asset and liability accounts, such as inventories, customers, and suppliers, derived from the balance sheet, are used to determine operating, investing, and financing cash flows.
Why can shareholders' equity be negative?
Shareholders' equity becomes negative when total liabilities exceed total assets, a situation that can result from accumulated losses, excessive dividend distributions, asset write-offs, or accounting restructurings. This condition indicates a significant equity imbalance and requires a detailed analysis of the causes and the capacity to reverse it.